- Abstract
iLOV domain is a useful orogenetic tool derived from C426A variant of LOV2 domain. In this study, iLOV photochemical properties were examined and compared to the wildtype LOV domain. iLOV protein was extracted after being expressed in E. coli cells, it was purified by CaM affinity chromatography. Its concentration was determined by Bradford Assay. Then, its purity and molecular weight were determined by performing SDS-PAGE. To examine the reactivity of iLOV in response to light stimulation, absorption of the sample was measured during dark, and during light irradiation at a wavelength range of 320-520 nm, and it was compared to the wildtype LOV domain. The results indicated that the mutant iLOV did not respond to the light, while the wildtype LOV domain showed reduced absorption during light indicating its reactivity as response to light irradiation. Regarding florescence properties, three LOV-based plasmid variants transformants were examined under two temperatures 37°C and 70°C. It’s found that iLOV expressing plasmid pET-iLOV have the highest fluorescent level at 37°C compared to the LOV expressing plasmid pET-TeLOV which is due to the improvement if iLOV properties. However, although pET-iLOV was expressed at the 70°C, its growth was lower that of pET-TeLOV, which showed the highest growth level at 70°C due to its thermophilic origin from T. elongatus. and pET-HmLOV showed no expression. Finally, the level of expression of pDUSK and pDAWN transformants was compared in dark and light, the results indicated that pDUSK was activated during dark, and pDAWN was activated during light.
- Introduction
For many years artificial manipulation of neuron cells has been a major challenge in studying brain and nervous system. That’s because neurons were stimulated by electrical or chemical stimulus mechanisms, which are not very specific to cells. Stimulating neurons traditional mechanisms lead to off target cells stimulation. (Williams & Entcheva, 2015). This is where optogenetics has revolutionized the study of neurons. Transforming of neurons of interest by light sensitive proteins allowed us to target these specific neurons and excite them by light and alter their membrane potential to activate cells and study them without any interreference from off target cells, which is a very selective approach compared to the traditional approaches. (Wichert et al., 2021). Therefore, Photoreceptor/ light-sensing proteins are essential tools for optogenetics.
Photoreceptor proteins are found naturally in various species such as bacteria, algae, and plants. The Light, Oxygen or Voltage sensing LOV domains is among the photo sensing proteins that have been utilized for different purposes to study gene expression in tissues. (Nakajima et al., 2021). LOV domains are relatively small proteins consisting of around 110 amino acids, (Christie et al., 1999) and it is a part of the Per-ARNT-Sim (PAS) superfamily (Crosson & Moffat, 2002). It is used to create artificial photo switches to manipulate gene expression in response to light. (Liu et al., 2022) The wildtype LOV2 domain consists of five β-sheets and four α-helices (Figure 1). and it adducts covalently to the carbon 4a of the chromophore flavin mononucleotide (FMN) through Cys966 residue (Crosson & Moffat, 2002). In addition, its structure contains Gln residue located in the Iβ strand, which is very essential for sensing light in LOV domain, (Figure 15) as its hydrogen bonds are switched with the FMN as response to light (Nash et al., 2008).
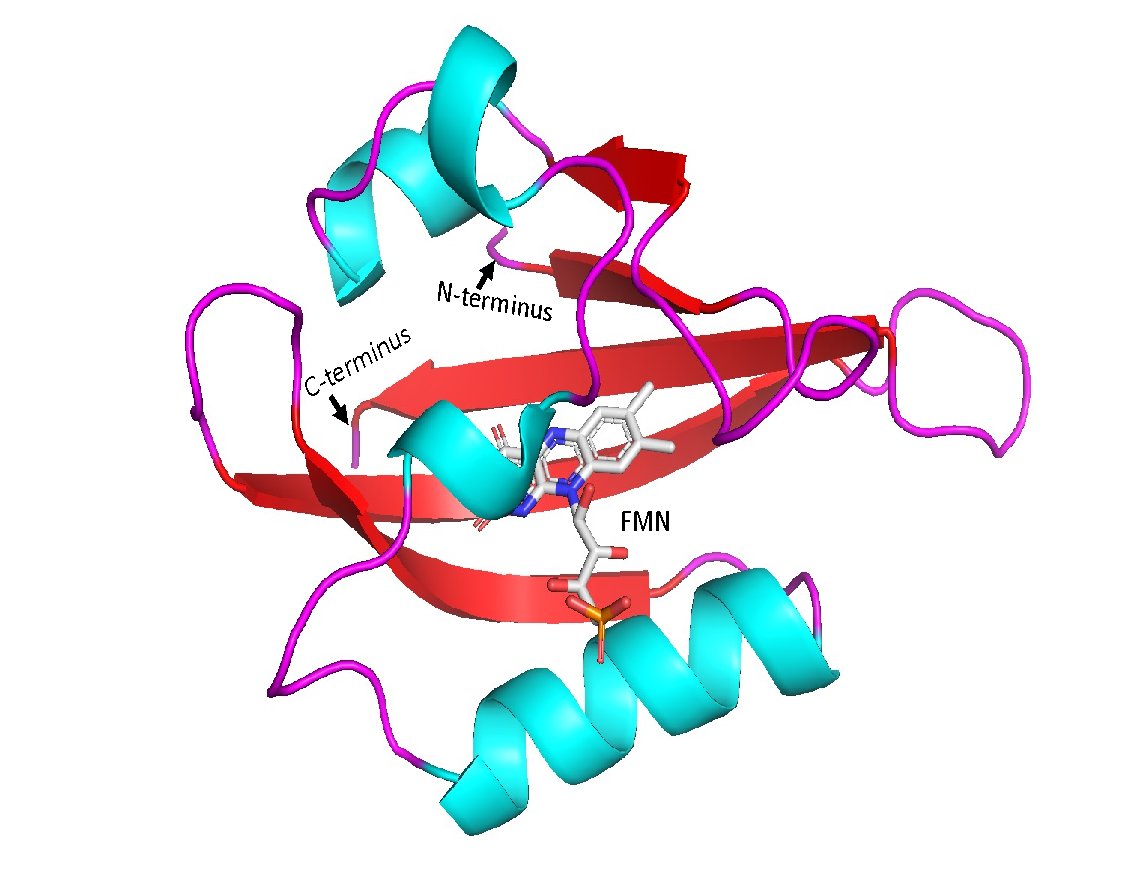
Figure 1: Cartoon diagram for the LOV2 domain structure. The secondary structure cartoon representation shows four α-helices in blue color, and five anti-parallel β-sheets in red color. The secondary structure elements starting from N-terminus are Aβ, Bβ, Cα, Dα, Eα, Fα, Gβ, Hβ, Iβ ending by the C-terminus. The flavin mononucleotide FMN chromophore is in the middle shown as gray sticks.
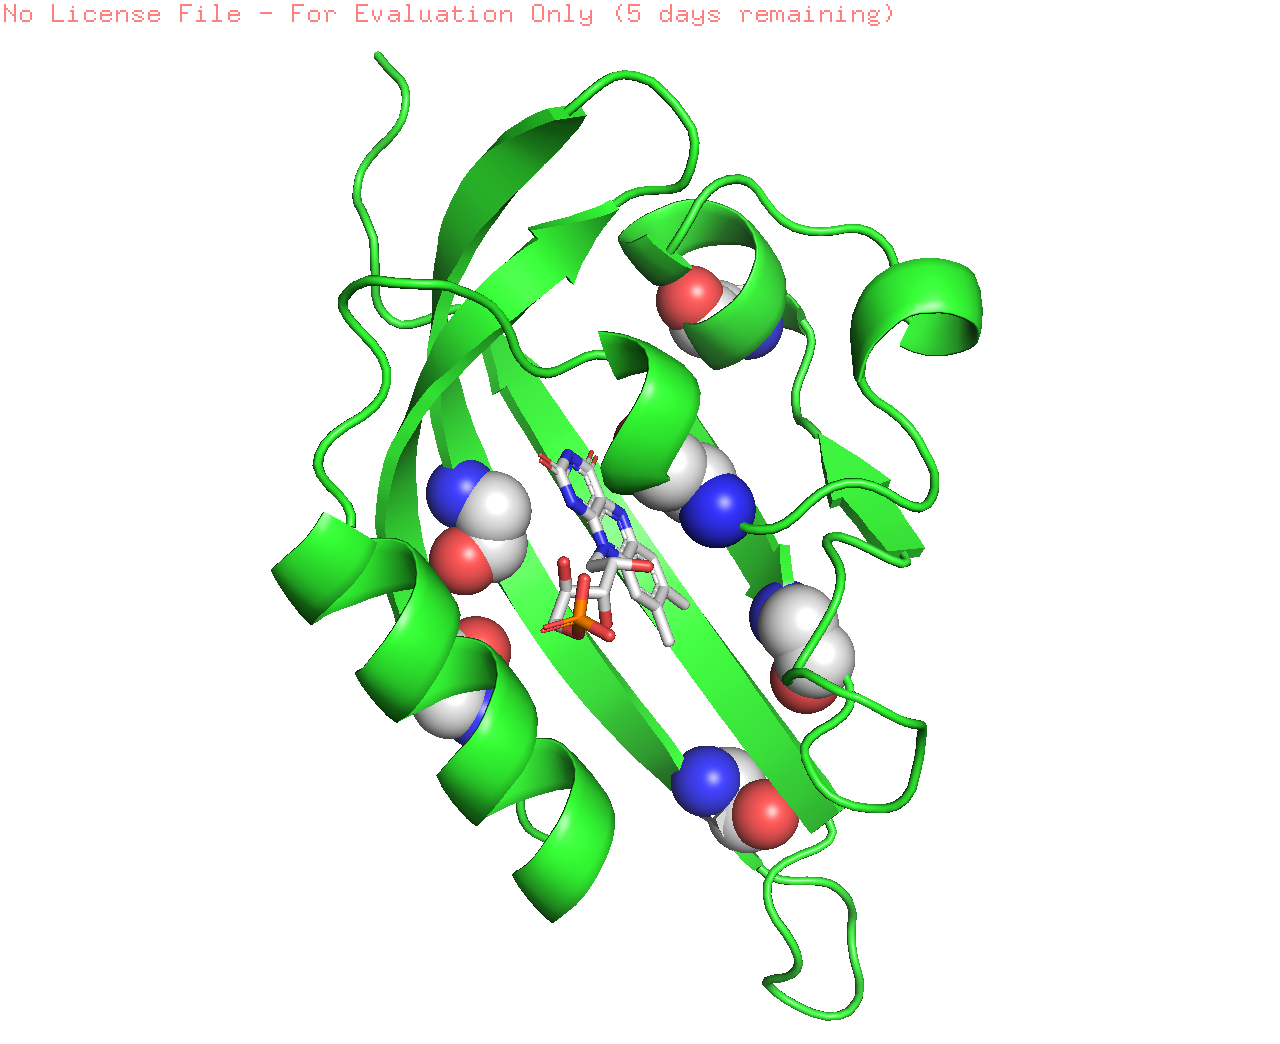
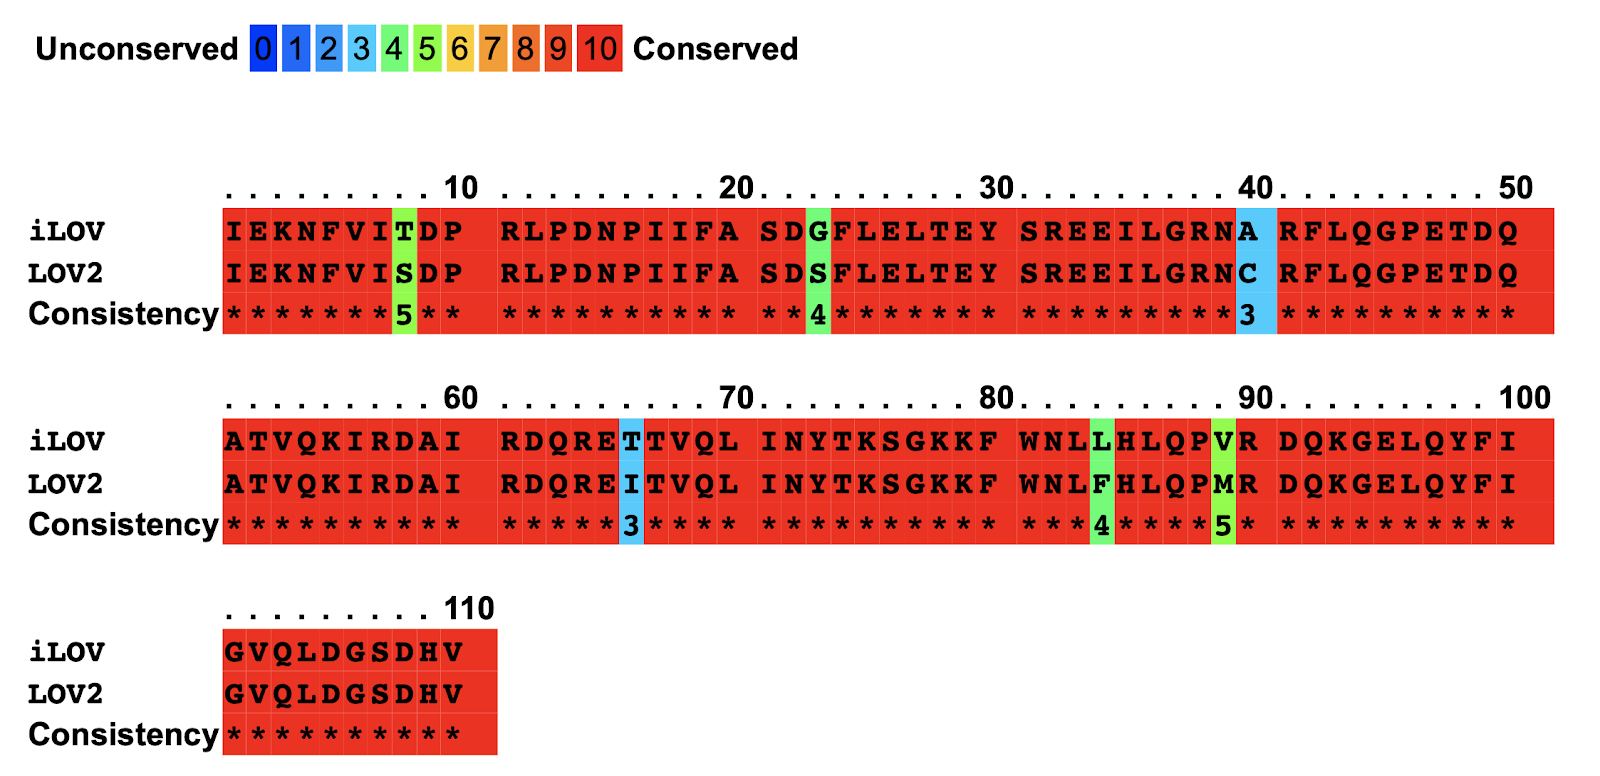
C426A is an inactive variant of LOV2 domain of Arabidopsis phot2, and it has been modified to create iLOV domain with an improved florescent property. (Christie et al., 2012) Six mutations have been introduced to derive the improved iLOV including Ser394Thr, Ser409Gly, Cys426Ala, Ile452Thr, Phe470Leu, and Met475Val (Figure 2).
 |  |
| a | b |
Figure 2: Representation of the mutations introduced in the LOV domain to create iLOV . a. the structure of LOV domain with the six mutations presented as spheres. b. the mutations presented in the sequence of LOV2 and iLOV, with red symbolizing the most conserved sequences, and blue symbolizing the unobserved sequence, where mutations occurred.
The mutations in iLOV have introduced conformational changes to its overall structure and properties. The mutation located at the loop between the Hβ and Iβ close to the C-terminal have changed the flexibility of the loop and increased its rigidity, therefore, it’s shown that flexibility of iLOV is less compared to the wildtype LOV. In addition, two mutations in iLOV are closely associated with FMA chromophore which are the Thr394 and Leu470, these mutations have restrained FMN and limited its movement, which will interfere with the FMN ability to absorb light and consequently, limits iLOV response to light. On the other hands, it is found that the mutation on residue Leu472 improves the fluorescence properties of iLOV compared to wildtype LOV (Christie et al., 2012) this enables us to utilize iLOV as fluorescent reporter. And it is suggested to be a better alternative for the GFPs. (Wang et al., 2017)
Different LOV plasmid variants have been designed to be used as expression systems. Such as pET-iLOV, which expresses iLOV protein, pET-TeLOV derived from Thermosynechocus elongatus, and pET-HmLOV derived from Halarcula marismotui. (Christie, 2022). In addition, a closely related photoreceptors system from PAS subfamily is encoded by pDAWN and pDUSK plasmids, which encode YF1 synthetic histidine kinase obtained from the FixL from Bradyrhizobium japonicum. (Ohlendorf et al., 2012) As presented in figure 3, the structure is similar to LOV domain in terms of the β-strands and the α-helices. However, FixL contains an addition α-helix (Jα helix), which can be used to regulate kinase activity during dark or light (Pudasaini et al., 2015). Moreover, YF1 has been modified to contain LOV domain (Figure 16). pDAWN and pDUSK plasmids are designed to express DsRed which emits fluorescence and can be used to assess their level of expression. (Ohlendorf et al., 2012)
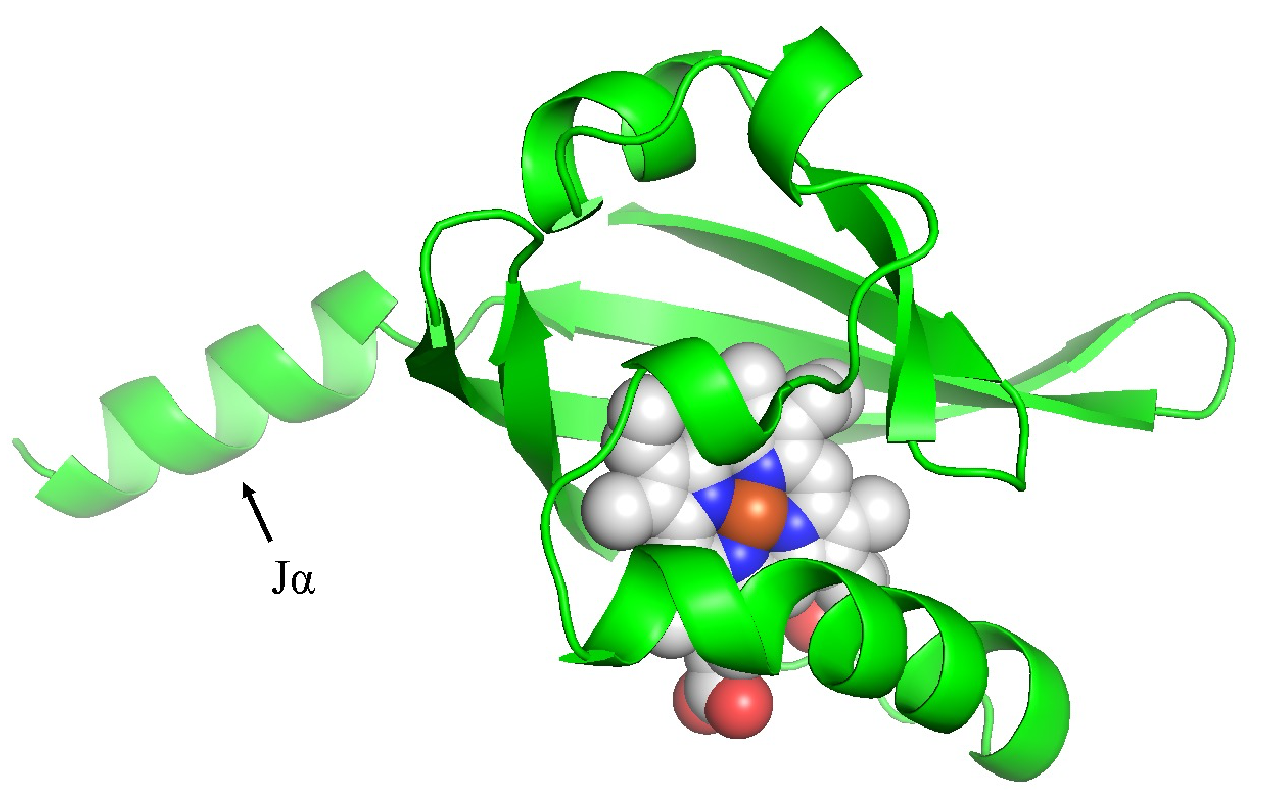
Figure 3: Cartoon diagram for the PAS domain of the FixL. The diagram shows five β-sheets and five α-helices including the additional Jα helix pointed by an arrow. and the cofactor presented as spheres.
The aim of this paper is to study the photochemical properties of iLOV protein and compare it to the wildtype LOV2 domain. We hypothesize that the mutations in iLOV will reduce its response light and improve its florescence. Photochemical properties are examined by spectroscopy, and the fluorescence is assessed by studying LOV-based variants transformants.
- Results
- iLOV purification and concentration determination by Bradford assay
iLOV protein was extracted from transformed E. coli cells. and it was purified by Calmodulin (CaM) affinity chromatography. Four elution fractions were collected.
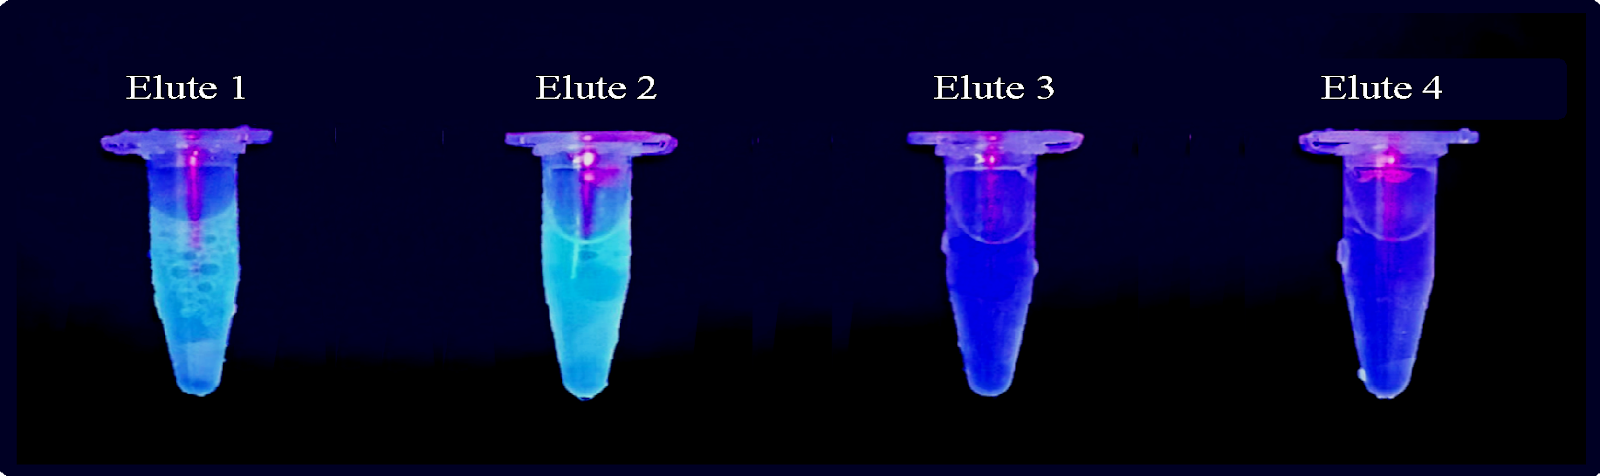
Figure 4: Elution fractions of iLOV protein obtained by CaM affinity chromatography imaged under UV light. fluorescent color intensity corresponds to the protein concentration.
Concentration of the four fractions was determined by performing Bradford assay. Absorbance of standards was measured, standard curve was plot, and absorbance of iLOV protein elution fractions was measured. Protein concentration calculation based on the standard curve.
Table 1: absorbance of four elution fractions at A595 and
| Elute 1 | Elute 2 | Elute 3 | Elute 4 | |
| Absorbance 595 | 0.238 | 0.188 | 0.026 | 0 |
| Concentration (g/l) | 0.729 | 0.567 | 0.041 | 0 |
- SDS-PAGE
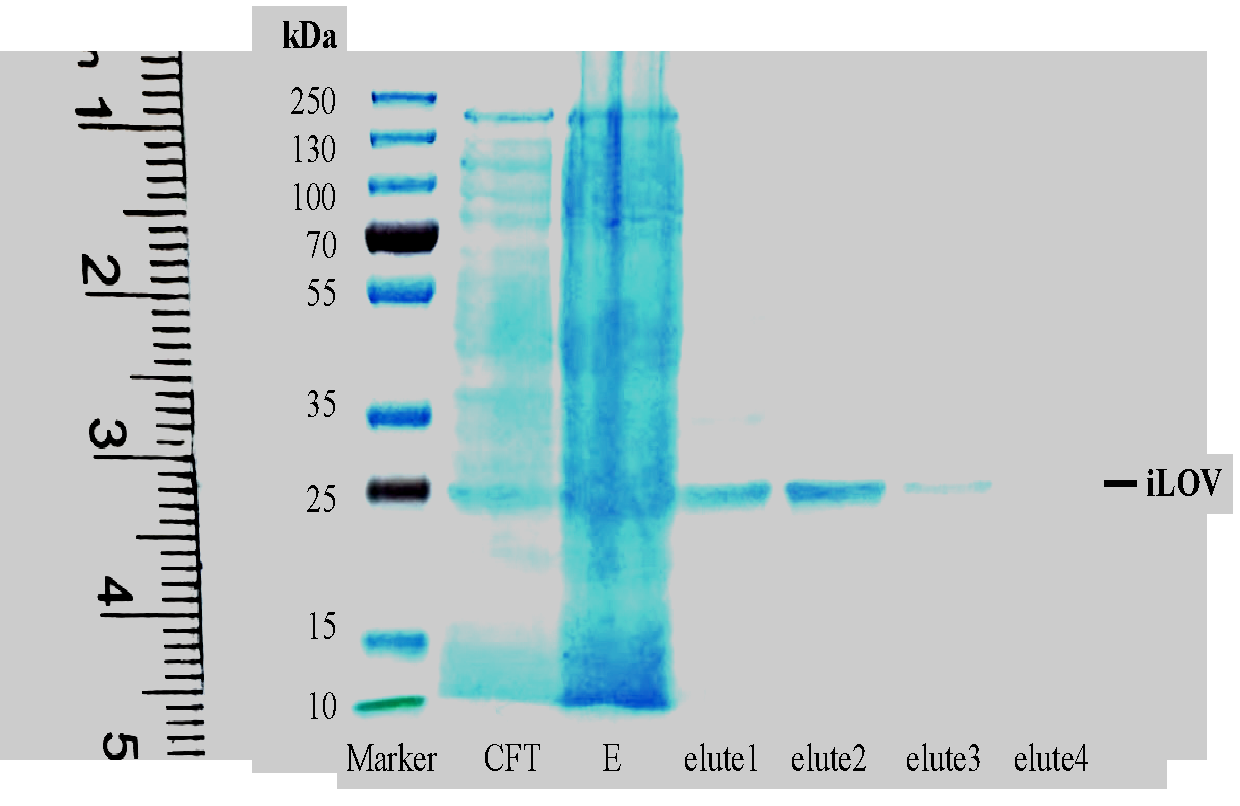
Figure 5: SDS-PAGE image analysis of iLOV extracted by CaM affinity chromatography. The purified extract fractions were separated in 10% SDS-PAGE to assess purity and molecular weight of the protein. Lane 1, protein molecular marker (10-250 kDa). Lane 2, column flow through (CFT). Lane 3, E. coli cells extract (E). Lanes 4-7: Elutes 1-4.
- Absorbance spectroscopy and photochemistry
 |
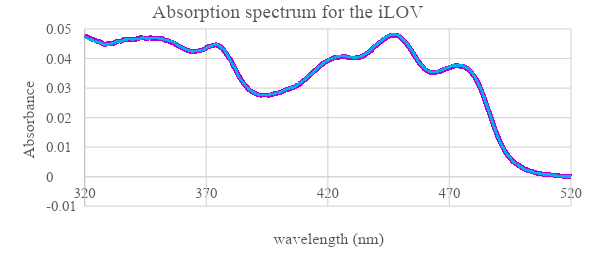 |
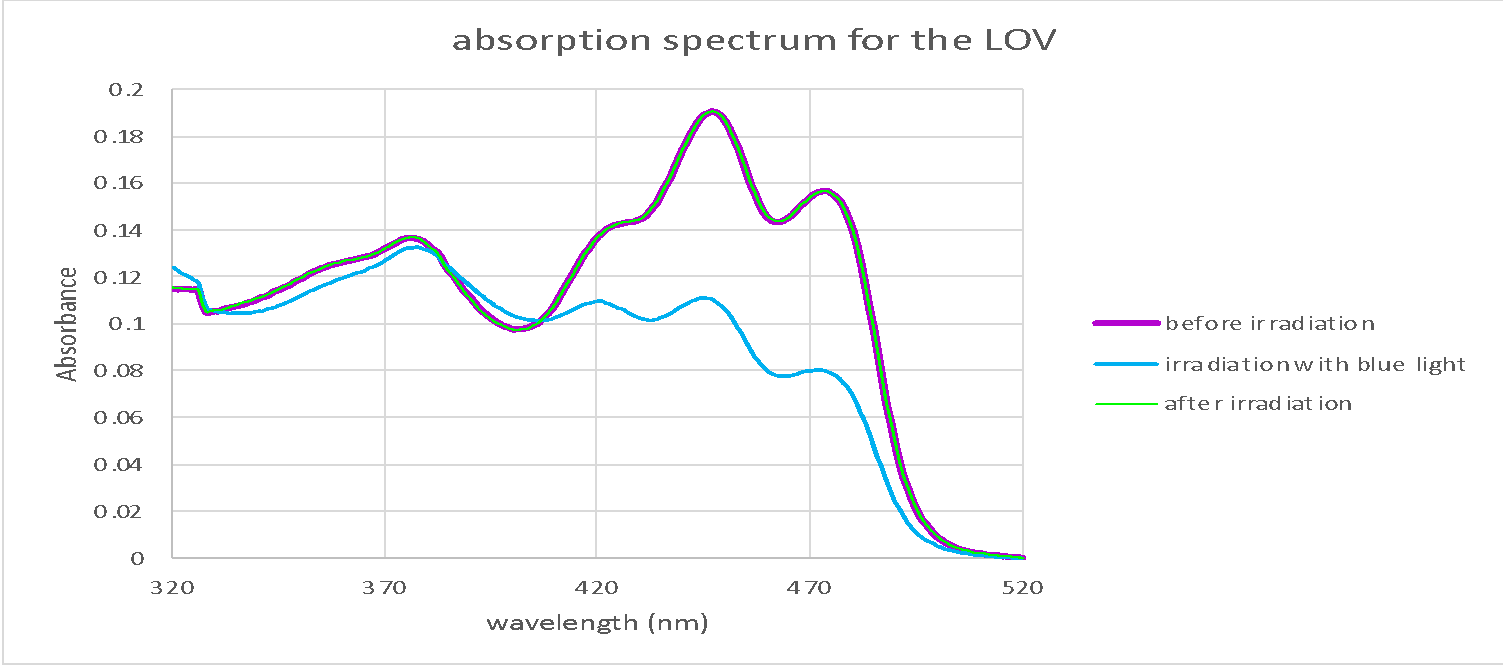
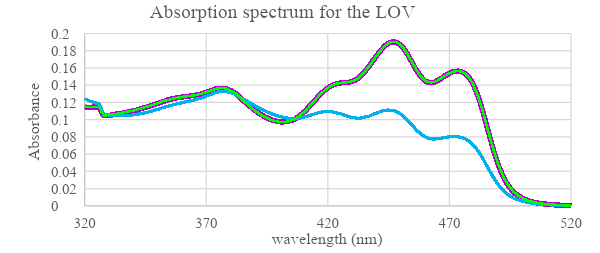
Figure 6: Absorption spectra in wavelength range 320-520 nm for wildtype LOV protein (retrieved from Chang, J., and Chen, J. 2022) and iLOV protein before and after irradiation with blue light. First absorption was measured in dark before sample irradiation (purple line). Then samples were irradiated with high intensity blue light and the second absorption reading was measured (blue line). Since the change was only observed in the wildtype LOV after radiation the sample was put back in dark and absorbance was measured again for LOV (green line).
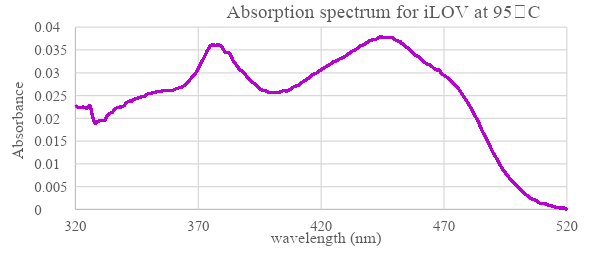
Figure 7: Absorbance spectrum of boiled iLOV protein at wavelength range 320-520 nm. Reading of released FMN after denaturing iLOV sample by heating it at 95°C for 5 minutes.
- E. coli transformants by LOV-based plasmid variants
- Characterizing the fluorescent properties of LOV variants
E. coli BL21 liquid cultures were transformed with four different LOV-based plasmids pET, pET-iLOV, pET-TeLOV, and pET-HmLOV, to examine their fluorescence properties.
 |  | 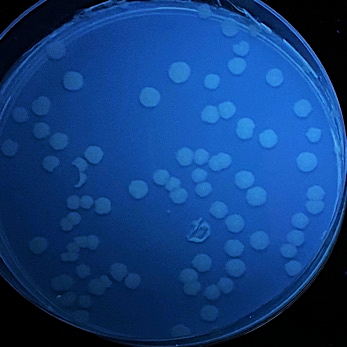 | 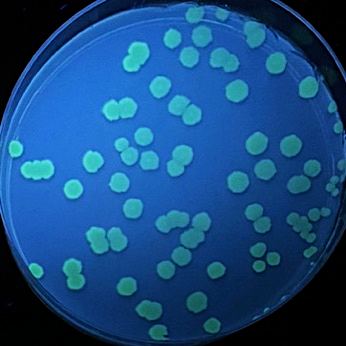 |
| pET (control) | pET-iLOV | pET-HmLOV | pET-TeLOV |
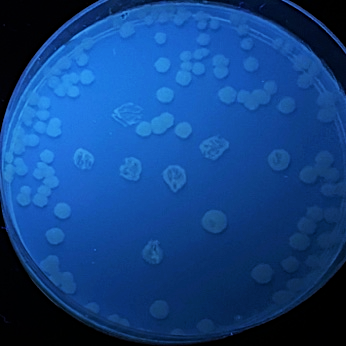
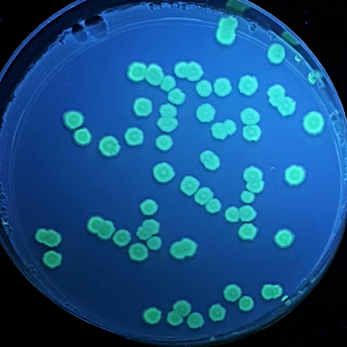
Figure 8: E. coli cultures fluorescence analysis for four different LOV-based plasmids variants. E. coli cells transformed with pET (control), pET-iLOV, pET-HmLOV, and pET-TeLOV. plated in LB-agar plates with IPTG and kanamycin as an antibiotic marker for selection. The colonies obtained are imaged under UV light to examine fluorescence of the samples.
- Impact of Light Intensity on DsRed Expression of pDUSK and pDAWN
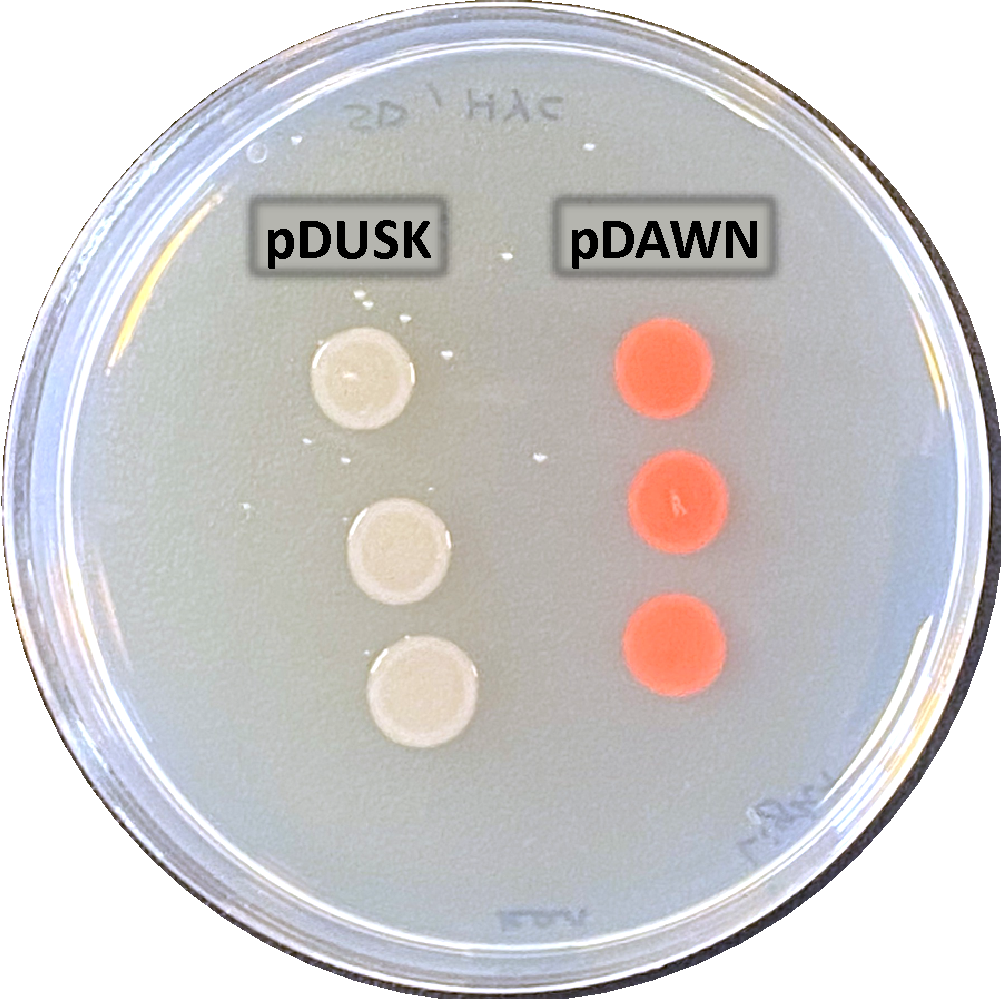 | 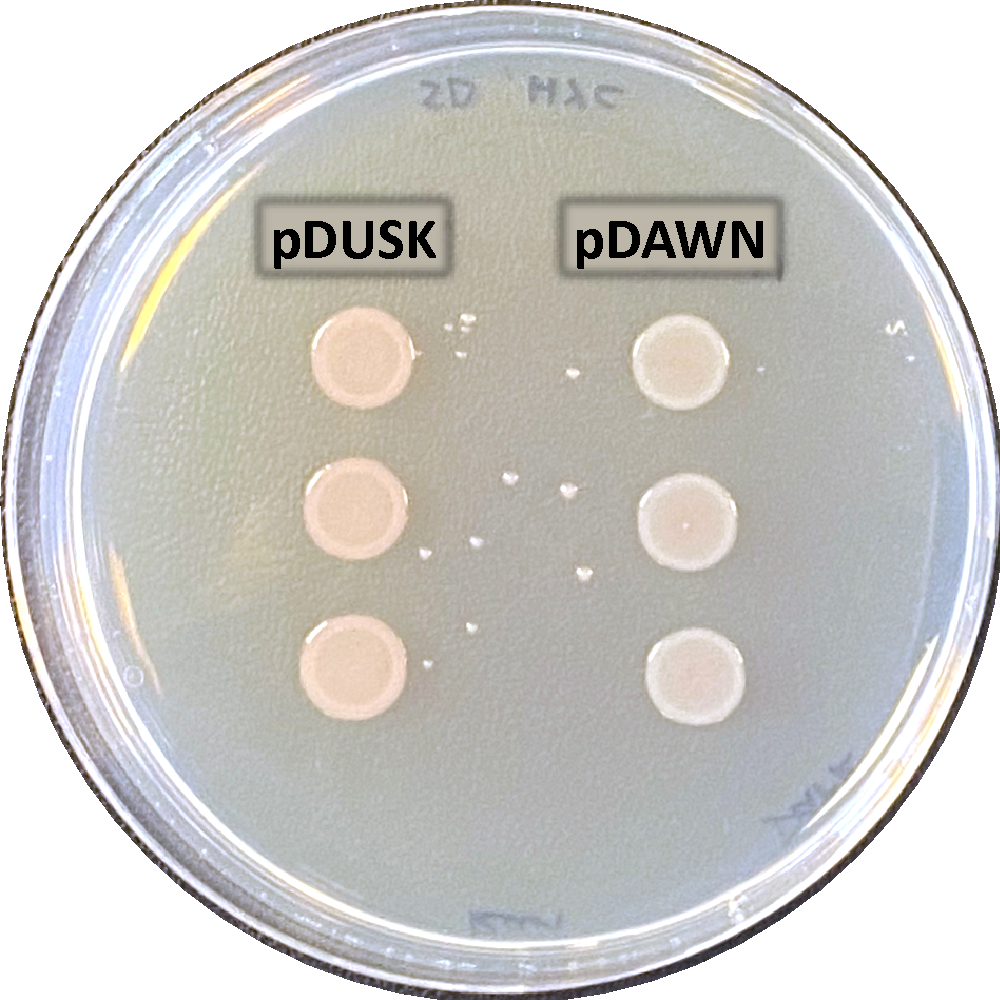 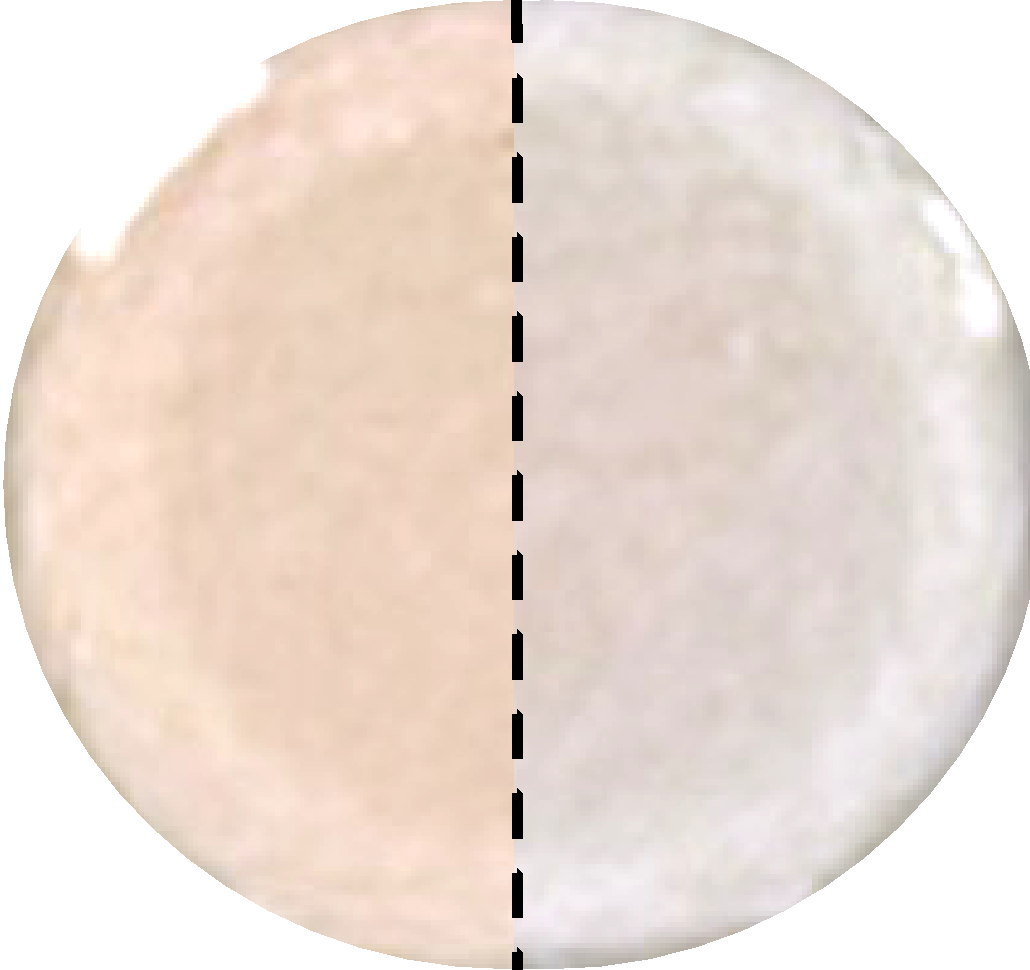 |
| a. Incubated overnight in light | b. Incubated overnight in dark |
Figure 10: Light regulation of DsRed expression using pDUSK and pDAWN plasmids. E. coli transformants plated in LB-agar with Kanamycin antibiotic marker for selection. a. shows pDUSK and pDAWN cultures in light. b. shows pDUSK and pDAWN in dark, with zoom frame representing half of each colony type in dark to compare the color difference.
Using fluorescence spectrophotometer, the light emission at 583 nm was measured for pDUSK and pDAWN E. coli transformants after being exposed to blue light with 558 nm to target DsRed.
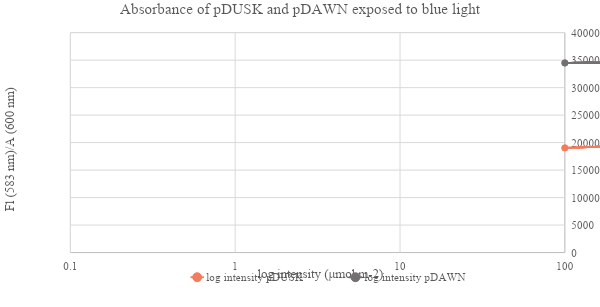
Figure 11: The impact of blue light intensity (μmol m-2) on growth difference of pDUSK and pDAWN transformants. E. coli liquid cultures measured at A600 and presented as Fl (583 nm)/A (600 nm)
- Discussion
The four fractions of iLOV obtained by CaM affinity chromatography visualized under UV light (figure 4) show that the first two elute fractions have the highest concentration of protein. Concentration determined by Bradford assay (table 1) indicated that elute 1 has the highest concentration of 0. 729 (g/l), followed by elute 2 which has concentration of 0. 567 (g/l), However, when comparing the fractions in SDS-PAGE results (figure 5), it is shown that elute 1 was less pure than elute 2. Due to its high concentration Elute 1 was chosen for the spectroscopy. However, it could be also successful to choose elute 2 as it shows slightly higher level of fluorescence compared to elute 1 by looking at the color of tubes (figure 4) which suggests that the high concentration of elute 1 is due to presence of proteins other than our protein of interest, and that agrees with the purity assessment of the sample by SDS-PAGE. Then, to determine the molecular weight of our protein of interest, protein weight marker was used to plot the standard curve and it revealed that the size of our purified protein is 26.13 kDa, which is quite larger than expected size of iLOV.
iLOV Absorbance spectroscopy was compared to the wildtype LOV domain to examine how the light influence its expression. The results (figure 6) show that for both wildtype LOV and iLOV the spectra of absorption before irradiation were almost similar, However, with the blue light irradiation absorbance of LOV domain is reduced particularly at wavelengths above 420 nm. While no change was observed in the absorbance of the mutant iLOV. When LOV protein was returned to dark its absorbance curve went back to the initial state as before irradiation. The possible reason behind non-responsive iLOV is due to the mutations at Hβ / Iβ loop and the mutations associated with the FMN which together increased the rigidity of iLOV structure and limited FMN movement (Christie et al., 2012) as FMN adducts to Cys966 from the LOV domain in response to light stimulation (figure 14) Therefore, this response was not possible in the mutant iLOV. When iLOV was heated at 95 °C (figure 7) it released FMN and the protein was denatured, which is due to breaking the hydrogen bonds.
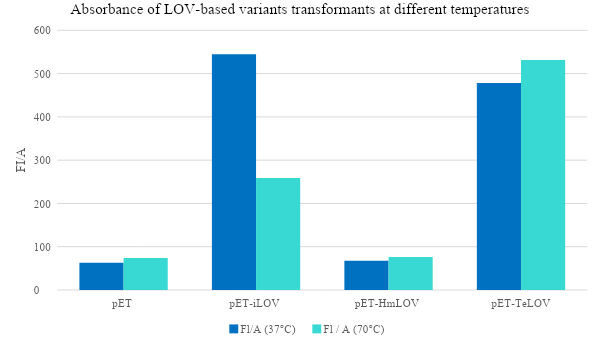
Examination of the fluorescence emitted by the E. coli transformants under UV light (figure 8) showed that pET plasmid was not expressed since it’s a control sample and it doesn’t encode our protein of interest. pET-iLOV plasmid shows an expression of iLOV protein, and similarly there is an expression for LOV protein from pET-TeLOV plasmid. However, Unexpectingly pET-HmLOV plasmid didn’t express the LOV protein, and since it was grown successfully in kanamycin antibiotic plate that indicates that its resistance plasmid was successfully expressed, therefor, possible reasons for not expressing our protein of interest might be due to instability of the gene itself. For Further investigation of the LOV-based plasmid variants, their growth under different temperatures was measured and graphed in Figure 9, which shows that pET control and pET-HmLOV have no expression, as for pET-iLOV there was a high level of expression at 37 °C and lower expression at 70 °C indicating that 70 °C is less favorable temperature for iLOV expression by this plasmid. As for pET-TeLOV plasmid it shows high expression at both temperatures. And this is due to the origin of pET-TeLOV which is a T. elongatus, a thermophilic organism (Stirbet et al., 2019) that resists high temperatures. When comparing the fluorescence of iLOV from pET-iLOV plasmid with the LOV from pET-TeLOV plasmid (Figure 8) it is observed that the intensity of fluorescence in the iLOV plate is higher than that of LOV plate. And that agrees also with the absorbance measured at A600 for pET-iLOV and pET-TeLOV at 37 °C where iLOV recorded higher absorbance (Figure 9). It is indicated that this difference in fluorescence improvement in iLOV is due to the mutations introduced to its structure.
In a comparison between DsRed expression in pDUSK and pDAWN E. coli transformants. Results in figure 10 show that DsRed was highly expressed in pDAWN in light while it was not expressed in pDUSK. Contrarily, DsRed was expressed in pDUSK in dark and not expressed in pDAWN although the expression of DsRed was not very clear in the dark sample, which might be due to human error as there might have been an unproper wrapping for the plate that allowed light seep to reach the sample and interfer with the result, however, a very slight difference between pDUSK and pDAWN colonies colors can be observed as presented in the small zoomed frame (Figure 10 b), which suggests that DsRed was activated in pDUSK and expressed in a very low level. To further confirm this observation, the growth levels of pDUSK and pDAWN was examined at an increasing blue light intensity (figure 11). we can see that unlike pDAWN transformants, the growth of pDUSK was increasing with the increase of light intensity. Which confirms that pDAWN plasmids are activated during light, and pDUSK plasmid is activated during dark.
In conclusion, this study has evidenced that the mutant iLOV was not responsive to light stimulation compared to the wildtype LOV domain, and that it has an improved florescence compared to the wildtype LOV at moderate temperature (37 °C). Therefore, iLOV could be efficiently utilized as fluorescent reporter. As for pDUSK and pDAWN expression systems it is shown these plasmids could be utilized to regulate expression on light and dark by light stimulation. This study requires more trials to correct human error and improve the results. In addition, we suggest that more research on LOV-based plasmids could enhance the efficiency of photoreceptors’ expression at wider range of temperatures. Photoreceptor proteins have proven their effectiveness for protein expression manipulation and as fluorescent reporter tools that play a major role in optogenetics research.
- Appendices
Table 2: Bradford assay standards and their absorbance readings at 595
| BSA (μg) | Amount of BSA stock required (μl) | Amount of water required (μl) | A595 |
| 0 (blank) | 0 | 100 | 0 |
| 0.5 | 5 | 95 | 0.051 |
| 1.0 | 10 | 90 | 0.087 |
| 2.0 | 20 | 80 | 0.152 |
| 4.0 | 40 | 60 | 0.241 |
| 7.0 | 70 | 30 | 0.433 |
| 10.0 | 100 | 0 | 0.640 |
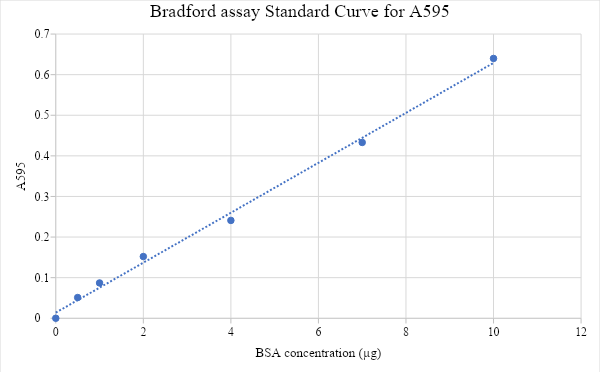
Figure 12: Bradford assay standard curve of protein concentration (μg) against its absorbance reading at A595. The protein concentration standards ranging from 0 (blank) to 10μg were measured by spectrophotometer to obtain their absorbance and generate the standard curve. Trendline equation is y = 0.0615x + 0.0139. the concentration of elute fractions was found by substituting y value with their absorbance vlaue and finding the value of (X). the concentration was converted to g/l and fraction of the sample was found by dividing the result by five (X/5) for each elute sample.
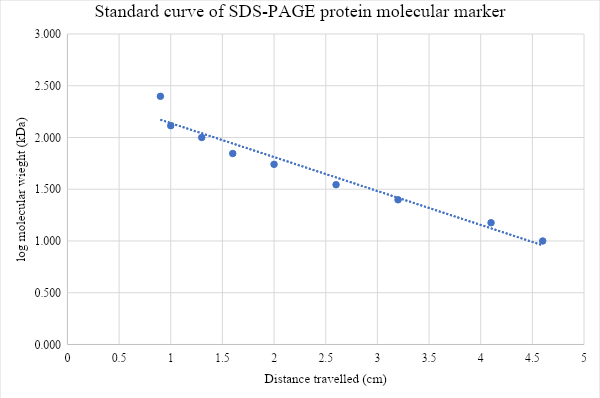
Figure 13: Standard curve of lo molecular weight of protein marker (kDa) against the distance travelled by each band in SDS-PAGE. Protein molecular weight calculation based on the standard curve (kDa). Trendline equation: y = -0.328x + 2.4668, the distance protein traveled is x= 3 cm. Y= -0.328 (3) + 2.4668 = 1.4172. iLOV molecular weight is Log (y) = Log (1.4172) = 26.13364576 kDa.
Table 3: The absorbance of blue light intensity by pDUSK and pDAWN transformants
| pDUSK | μmol m-2 | Fl 583 nm | A 600 nm | Fl (583 nm)/A (600 nm) | log intensity |
| 0.1 | 16112 | 0.553 | 29135.6239 | -1 | |
| 1 | 14050 | 0.565 | 24867.2566 | 0 | |
| 5 | 12212 | 0.561 | 21768.2709 | 0.69897 | |
| 10 | 11170 | 0.55 | 20309.0909 | 1 | |
| 50 | 10054 | 0.519 | 19371.869 | 1.69897 | |
| 100 | 9231 | 0.485 | 19032.9897 | 2 | |
| pDAWN | μmol m-2 | Fl 583 nm | A 600 nm | Fl (583 nm)/A (600 nm) | log intensity |
| 0.1 | 1112 | 0.545 | 2040.36697 | -1 | |
| 1 | 12450 | 0.592 | 21030.4054 | 0 | |
| 5 | 16324 | 0.554 | 29465.704 | 0.69897 | |
| 10 | 18582 | 0.558 | 33301.0753 | 1 | |
| 50 | 20231 | 0.587 | 34465.0767 | 1.69897 | |
| 100 | 22421 | 0.65 | 34493.8462 | 2 |
Table 4: Absorbance at A600 for LOV-based plasmids samples at 37 °C and 70 °C
| 37 °C | pET | pET-iLOV | pET-HmLOV | pET-TeLOV |
| Fl (495nm) | 63 | 544.8 | 67.4 | 478.4 |
| A600 | 0.942 | 0.978 | 0.76 | 1.072 |
| 70 °C | pET | pET-iLOV | pET-HmLOV | pET-TeLOV |
| Fl (495nm) | 73.8 | 258.8 | 76.3 | 531.6 |
| A600 | 0.942 | 0.978 | 0.76 | 1.072 |
 |  |
| In dark | In light |
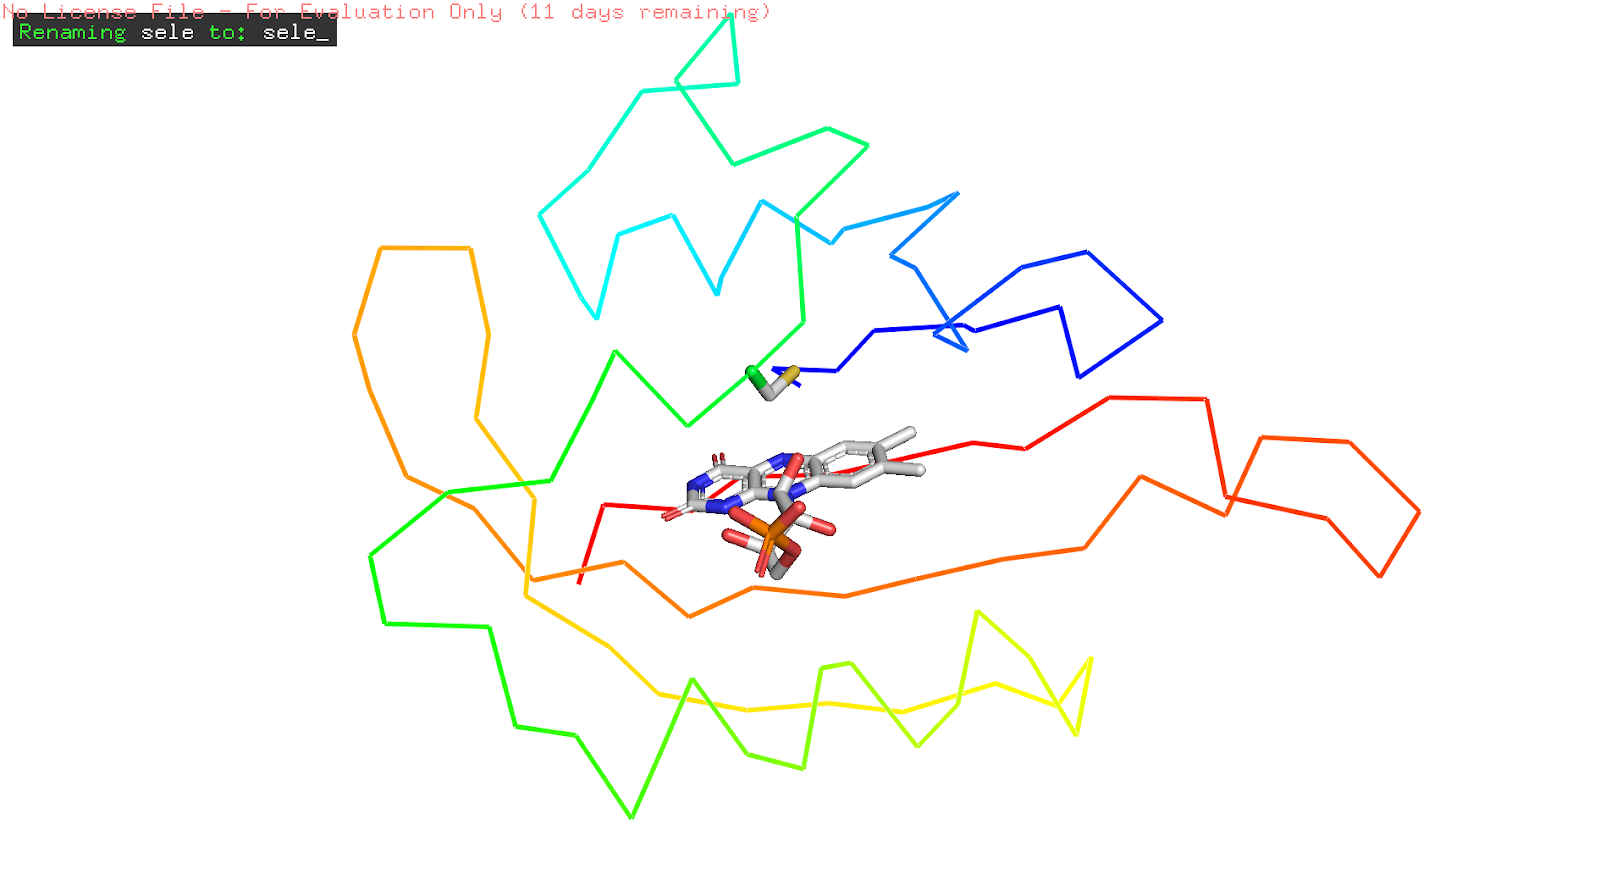
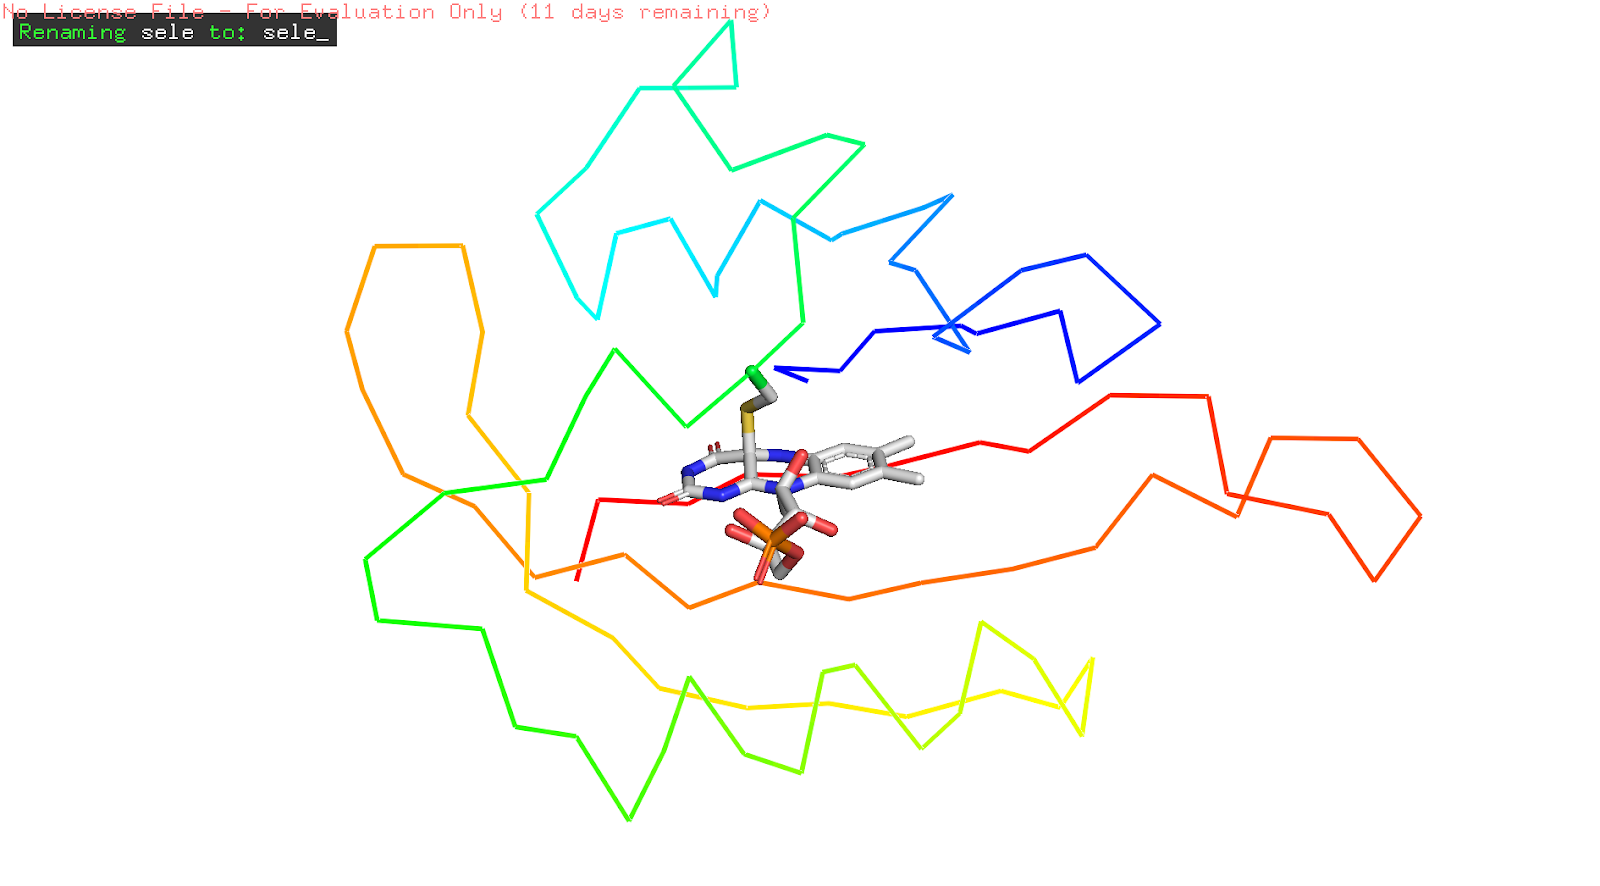
Figure 14: differences between the dark and light states of the FMN and the Cys966 residue. in light, LOV domain is activated with Cys966 covalent adduct to the isoalloxazine moiety. mutation in Cys966 would no longer be able to react to light.
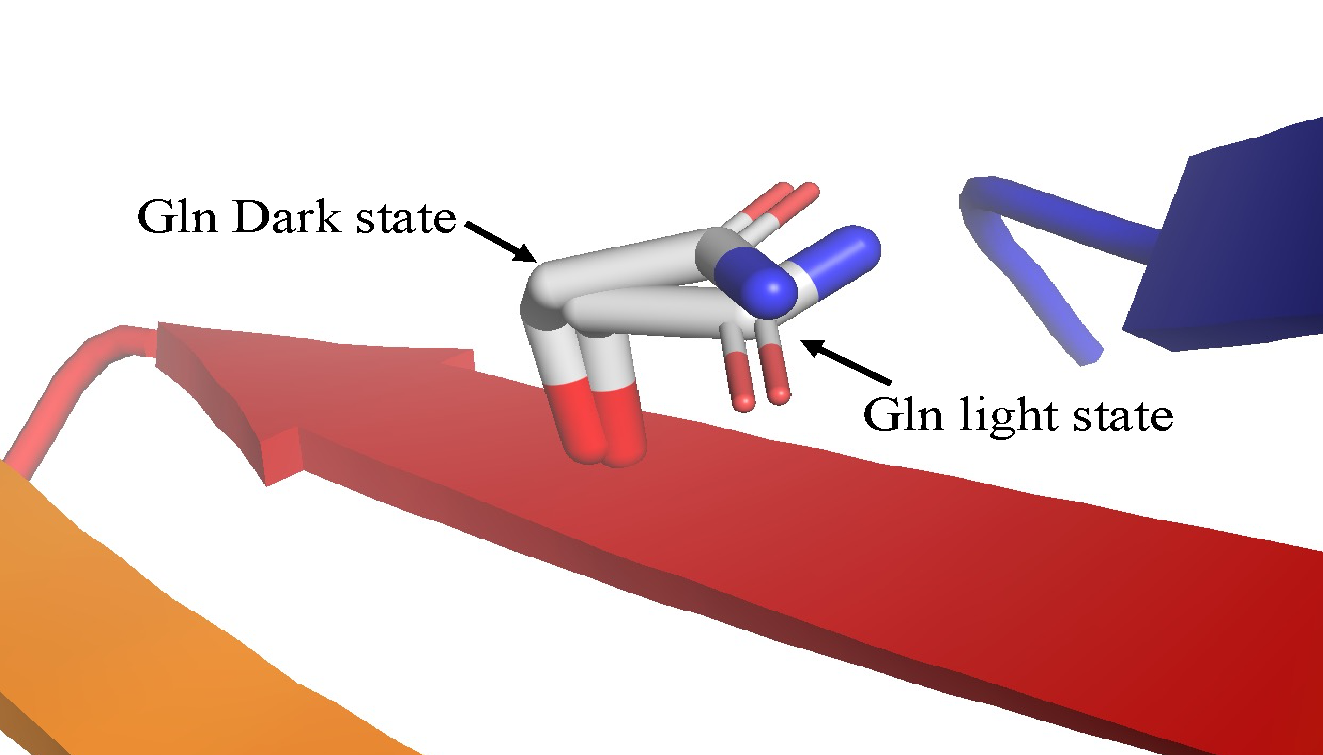
Figure 15: Diagram of the Gln residue on the Iβ strand of LOV domain in dark and in light state.
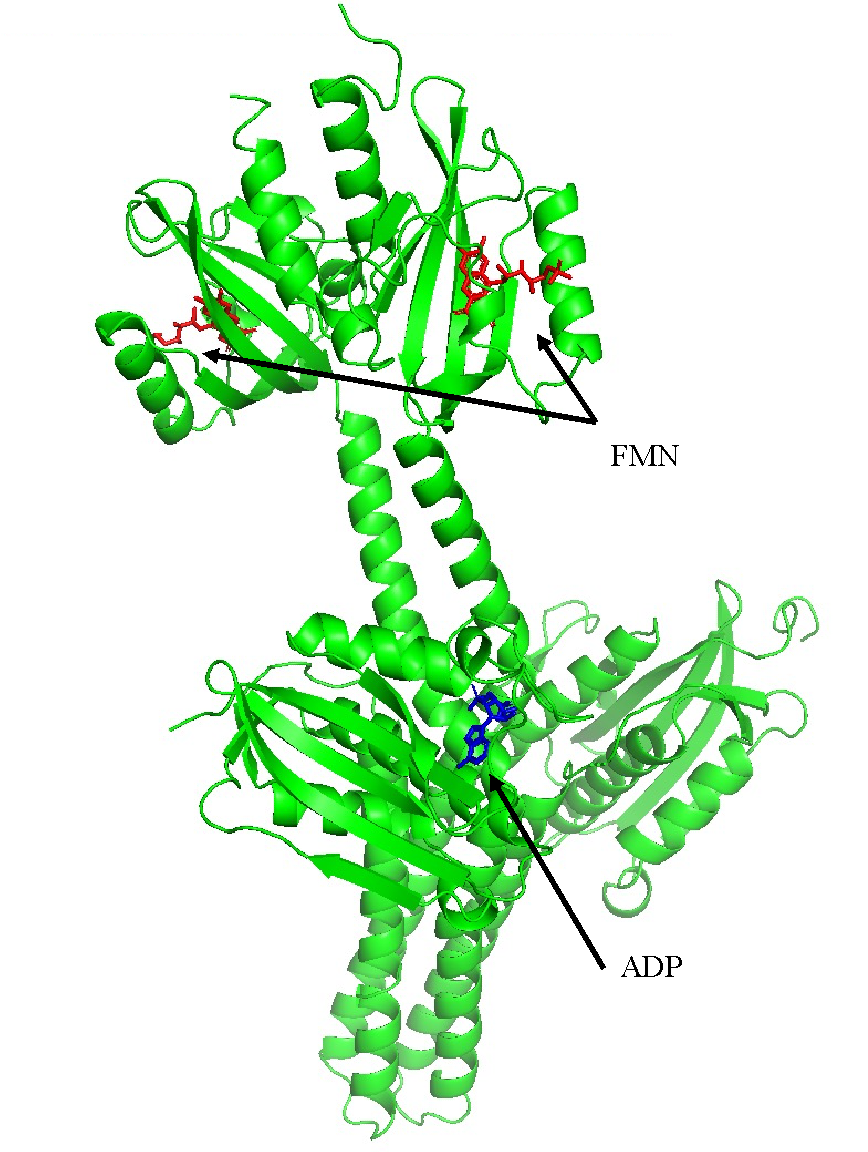
Figure 16: structure of full YF1 dimer. A modified YF1 dimer that contain LOV domain instead of PAS, FMN presented in red sticks, and molecule of ADP presented in blue sticks
- References
Chang, J., Chen, J. (2022), LOV-based Optogenetic Tools. biotechnology applications lab – MSc Biotech 2021/22.
Christie, J. M. (2022) LOV-based Optogenetic Tools. biotechnology applications lab manual – MSc Biotech 2021/22.
Christie, J. M., Gawthorne, J., Young, G., Fraser, N. J., & Roe, A. J. (2012). LOV to BLUF: Flavoprotein Contributions to the Optogenetic Toolkit. Molecular Plant, 5(3), 533–544. https://doi.org/10.1093/mp/sss020
Christie, J. M., Hitomi, K., Arvai, A. S., Hartfield, K. A., Mettlen, M., Pratt, A. J., Tainer, J. A., & Getzoff, E. D. (2012). Structural Tuning of the Fluorescent Protein iLOV for Improved Photostability. Journal of Biological Chemistry, 287(26), 22295–22304. https://doi.org/10.1074/jbc.m111.318881
Christie, J. M., Salomon, M., Nozue, K., Wada, M., & Briggs, W. R. (1999). LOV (light, oxygen, or voltage) domains of the blue-light photoreceptor phototropin (nph1): Binding sites for the chromophore flavin mononucleotide. Proceedings of the National Academy of Sciences, 96(15), 8779–8783. https://doi.org/10.1073/pnas.96.15.8779
Crosson, S., & Moffat, K. (2002). Photoexcited Structure of a Plant Photoreceptor Domain Reveals a Light-Driven Molecular Switch. The Plant Cell, 14(5), 1067–1075. https://doi.org/10.1105/tpc.010475
Liu, R., Yang, J., Yao, J., Zhao, Z., He, W., Su, N., Zhang, Z., Zhang, C., Zhang, Z., Cai, H., Zhu, L., Zhao, Y., Quan, S., Chen, X., & Yang, Y. (2022). Optogenetic control of RNA function and metabolism using engineered light-switchable RNA-binding proteins. Nature Biotechnology, 1–8. https://doi.org/10.1038/s41587-021-01112-1
Nakajima, H., Kobayashi, I., Adachi, Y., & Hisatomi, O. (2021). Transmission of light signals from the light-oxygen-voltage core via the hydrophobic region of the β-sheet surface in aureochrome-1. Scientific Reports, 11(1), 11995. https://doi.org/10.1038/s41598-021-91497-5
Nash, A. I., Ko, W.-H., Harper, S. M., & Gardner, K. H. (2008). A Conserved Glutamine Plays a Central Role in LOV Domain Signal Transmission and Its Duration†. Biochemistry, 47(52), 13842–13849. https://doi.org/10.1021/bi801430e
Ohlendorf, R., Vidavski, R. R., Eldar, A., Moffat, K., & Möglich, A. (2012). From dusk till dawn: one-plasmid systems for light-regulated gene expression. Journal of Molecular Biology, 416(4), 534–542. https://doi.org/10.1016/j.jmb.2012.01.001
Pudasaini, A., El-Arab, K. K., & Zoltowski, B. D. (2015). LOV-based optogenetic devices: light-driven modules to impart photoregulated control of cellular signaling. Frontiers in Molecular Biosciences, 2, 18. https://doi.org/10.3389/fmolb.2015.00018
Stirbet, A., Lazár, D., Papageorgiou, G. C., & Govindjee. (2019, January 1). Chapter 5 – Chlorophyll a Fluorescence in Cyanobacteria: Relation to Photosynthesis☆ (A. K. Mishra, D. N. Tiwari, & A. N. Rai, Eds.). ScienceDirect; Academic Press. https://www.sciencedirect.com/science/article/pii/B9780128146675000052
Wang, S. E., Brooks, A. E. S., Cann, B., & Simoes-Barbosa, A. (2017). The fluorescent protein iLOV outperforms eGFP as a reporter gene in the microaerophilic protozoan Trichomonas vaginalis. Molecular and Biochemical Parasitology, 216, 1–4. https://doi.org/10.1016/j.molbiopara.2017.06.003
Wichert, N., Witt, M., Blume, C., & Scheper, T. (2021). Clinical applicability of optogenetic gene regulation. Biotechnology and Bioengineering, 118(11), 4168–4185. https://doi.org/10.1002/bit.27895
Williams, John C., & Entcheva, E. (2015). Optogenetic versus Electrical Stimulation of Human Cardiomyocytes: Modeling Insights. Biophysical Journal, 108(8), 1934–1945. https://doi.org/10.1016/j.bpj.2015.03.032