- Introduction:
- Research question
Does doxorubicin drug have a significant effect on the level of expression of p21 regulatory gene in cancer cells?
This experiment will investigate the effect of DNA damaging agent doxorubicin on the regulation of tumor repressor gene p21 in a human breast cancer cell line MCF7. Relative expression of p21 with a reference gene is going to be examined in a doxorubicin treated cells, and non-treated cells using real time quantitative polymerase chain reaction (qPCR). The fold change in relative expression is going to be calculated to determine the significance of the change that might be caused by doxorubicin drug on treated cells.
- Scientific significance
Lost control of cell cycle is the cause responsible of cancer diseases. Cell cycle regulation involves highly regulated processes mediated by regulatory genes. p21 tumor repressor gene is among the most critical regulatory genes for cell cycle arrest at G1/S and G2/M transitions phases. It is induced by another regulatory gene which is p53 (Karimian et al., 2016). p53 is the main transcriptional regulator in cell cycle arrest and apoptosis (Chen 2016). During normal conditions in the cell p53 is expressed in a very low level, however, its level of expression raises when cell is stressed, or DNA is damaged. p53 triggers cell cycle arrest, and p21 as a consequence to undergo cell cycle arrest and repress tumor (Wang, et al., 2015). Doxorubicin in is a DNA damaging agent that is used to treat variety of cancer types. It exerts two different activities in cancer cells that lead to DNA damage, including the inhibition of topoisomerase II mediated DNA repair, and the formation of free radicals that damage the DNA (Thorn et al., 2012). In this paper doxorubicin drug is going to be tested on MCF7 breast cancer cells to determine its effect on the level of expression of p21. This experiment will serve as an evidence for the regulation of p21 tumor repressor gene by doxorubicin for the treatment of cancer cells. And will further our understanding of the pathway by which doxorubicin affect the essential regulatory gene p21 that have the capability to arrest cell cycle and repress tumors and treat cancer disease.
- Hypothesis
When cells are treated with doxorubicin, they undergo apoptosis as a response to the damage in the DNA (Thorn et al., 2012). Cell arrest involved p53 tumor repressor gene, which will upregulate p21 protein during apoptosis (Abbas & Dutta 2010). Therefore, it is hypothesized that treating MCF7 cells with doxorubicin will upregulate the expression of p21. For the purpose of the normalization of qPCR results, p21 expression is going to be compared to the expression of a housekeeping gene (beta-actin) that acts as a reference gene (Verna 2012).
- Results
- Treatment
MCF7 cell line was treated with 0.5um doxorubicin to be compared with a non- treated MCF7 cells. RNA was extracted and quantified using nanodrop spectrophotometer. The result of RNA quantification was 227 ng/ml from the treated sample, and 318.9 ng/ml for the untreated sample (Figure 1 A, B).
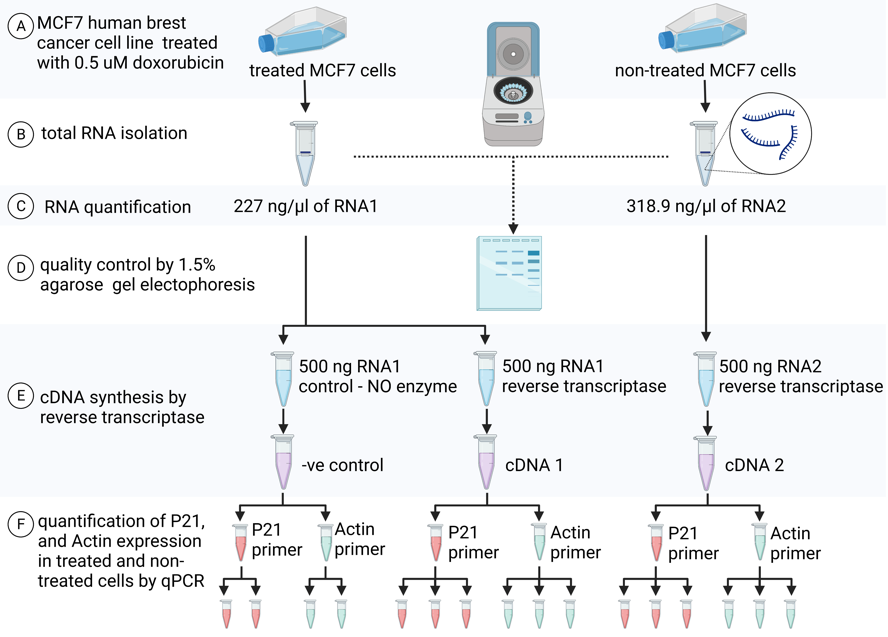
Figure 1: an overview of experiment design of MCF7 cells treatment with doxorubicin, RNA extraction and quantification, quality control, cDNA synthesis and real time qPCR with p21 and beta-actin primers
- Quality control
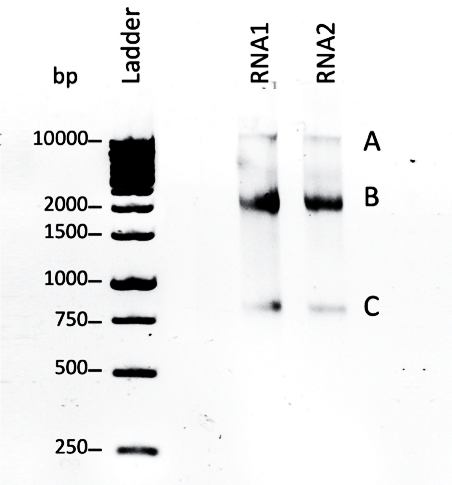
Quality control was performed by running total RNA from sample 1 and sample 2 in 1.5% agarose gel electrophoresis to assess RNA integrity. In both samples RNA1 and RNA2 there are two distinct bands at positions B and C of ratio 2:1 and size ~0.8kbp and ~2kbp corresponding to the 18S RNA and 28S rRNA subunits respectively.
A little pipetting error in band B from sample RNA1 resulted in an imprecise shape for the band. In addition, there is a third pale band in both samples at position A, that have a larger size ~10kbp.
- cDNA synthesis
An amount of 500 ng from each sample (RNA1 and of RNA2) was used for reverse transcriptase reaction to generate cDNA (Figure1 E) (Applied Biosciences High Capacity RNA to cDNA kit. Cat No 4387406) to be used for real time qPCR reaction. An approximation of synthesized cDNA concentration was calculated to be 25 ng/ul of cDNA in each sample.
- Real time qPCR
Real time qPCR was performed using triplicates from each sample and each gene. in addition to a negative control, which acts as a no templet control and was obtained from sample 1 (figure 1 F). The expression of GOI (p21) and RG (beta-actin) was measured in each sample by real time qPCR (Applied Biosciences steponeplustm System) using the primers presented in table 1. SYBR GREEN was used for the detection of amplification is qPCR (Applied biosciences SYBR Select Master Mix Cat No: 4472908).
Table 1: qPCR Primers
| Target gene | Primer name | Sequence *complementarity underlined |
| B-actin | Hactb-f1 | 5’- TGCACCACCAACTGCTTAGC -3’ |
| Hactb-r1 | 5’- GGCATGGACTGTGGTCATGAG -3’ | |
| p21 | Hsp21 F | 5′- GGCAGACCAGCATGACAGATT -3′ |
| Hsp21 R | 5′- AAGGCAGAAGATGTAGAGCGG -3′ |
- Melt curve analysis
 |  |
| Melt curve of the -ve control | Melt curve of the samples |
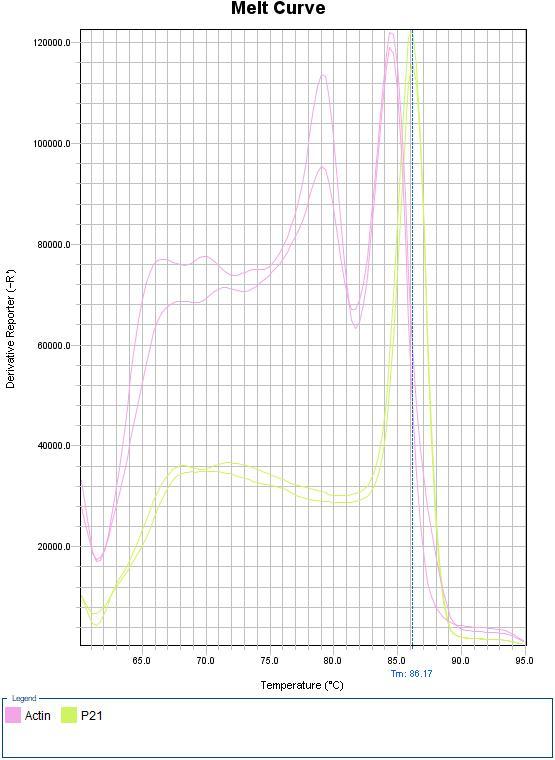
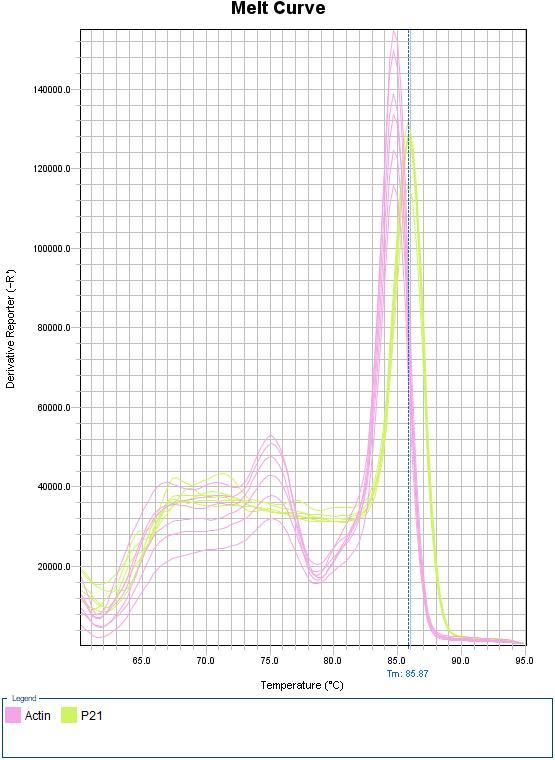
Figure 3: melt curve presenting Tm against derivative reporter (-R) Obtained from real time qPCR reaction for p21 (green) and beta-actin (pink). (A) negative control (B) Cell samples.
Looking at (figure 3 A), melt curve analysis for the negative control clearly shows a positive result for both p21 and beta-actin, indicating DNA contamination in the control. In addition, there is a high level of beta-actin which might be due to a human error during the preparation of master mix. Regarding the melting curve for samples 1 and 2 (figure 3 B) there are two distinct high peaks one for beta-actin at Tm 84.8°C and the other one is for p21 at slightly higher Tm 85.87°C. In addition, there are two lower peaks at lower Tm that might indicate low specificity of the reaction.
- Amplification plot
| A | 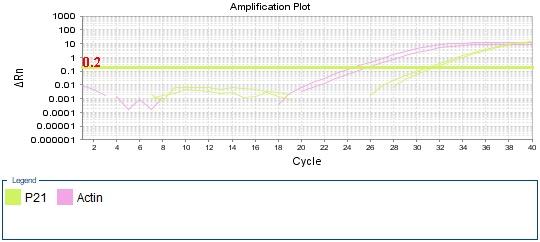 |
| B | 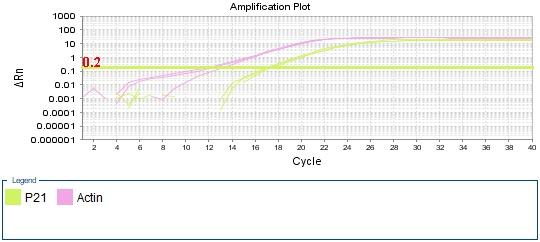 |
| C | 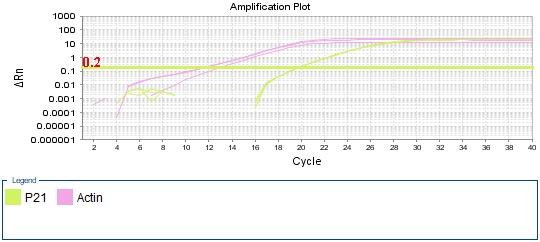 |
Figure 4: qPCR Amplifiction plot obtained from qPCR presenting the cycle number against ΔRn, with threshold marked in a straight green line. p21 amplification labled (green) and beta-actin amplification labled (pink). Ct values for each sample marked by dotted line. The graphs represent the amplification of (A) negative control. (B) sample 1 treated cells. (C) sample 2 non-treated cells.
Among all amplification plot diagrams, both the GOI p21 and RG beta-actin has shown an amplification. However, there is a difference in the level of amplification, control (figure 4 A) had the lowest amplification levels marked by high Ct values for both p21 and beta-actin at cycle 25 and cycle 31 respectively.
As for the treated and non-treated samples (figure 4 B, C) actin amplification has similar Ct values at cycle 13. However, p21 amplification was slightly higher in treated sample at cycle 17 compared to non-treated sample which was at cycle 20.
- Data analysis
For further analysis of qPCR results, ΔCt between p21 and beta-actin in each sample was calculated, and the resulted ΔCt values were used to find the ΔΔCt which is indicative of the effect of doxorubicin on the relative expression of p21.
Table 2: Ct values for p21 and Beta-actin from +doxorubicin treated cells and -drug untreated cell triplicates.
| Ct-beta-actin | Ct -p21 | ΔCt (RF-GOI) | Avg ΔCt | Stdev.S ΔCt | ΔΔCt | 2ΔΔct | |
| Sample 1: MCF7 cells+ doxorubicin | 12.27585506 | 17.66229 | 5.386431694 | 4.678561 | 0.77801657 | -2.90404 | 0.133597 |
| 13.38661289 | 17.23218 | 3.845564842 | |||||
| 12.66853619 | 17.47222 | 4.803685188 | |||||
| Sample 2: MCF7 cells- drug | 11.89190483 | 19.89024 | 7.998338699 | 7.582598 | 0.74089306 | 0 | 1 |
| 11.96159744 | 19.98385 | 8.022254944 | |||||
| 13.21731949 | 19.94452 | 6.727199554 |
The table above illustrates the Ct values for p21 and beta-actin in treated and untreated samples’ triplicates. ΔCt is the difference between p21 and beta-actin expression for each triplicate. Average ΔCt was calculated and it is smaller in the treated sample, which indicates a change in relative expression level. To find the fold change in relative expression ΔΔCt was calculated by substituting ΔCt of each sample from ΔCt of the untreated sample. Fold change was also presented as 2ΔΔct and the last column. The value is smaller in treated cells, which means that p21 have higher expression. Results of ΔΔCt values are presented in the chart (figure 5) for further explanation.
Table 3: Co-efficient of variance (CV) analysis
| Avg Ct b-actin | St DevCt b-actin | CVB-actin | Avg Ct p21 | St Dev Ct p21 | CV p21 | |
| Sample 1: cells+doxorubicin | 12.77700138 | 0.56327 | 4.40844 | 17.4556 | 0.21554 | 1.234780761 |
| Sample 2:Cells-drug | 12.35694059 | 0.74592 | 6.03648 | 19.9395 | 0.047 | 0.23572646 |
To assess the validity of the results, the variance around the mean was determined by calculating co-efficient of variance (CV). CV for each gene’s Ct value (p21 and beta-actin) was found by the formula CV% = (Standard Deviation Ct / average Ct) x 100
The results of CV values are presented in Table 3. CV value is higher than 4% for beta-actin in both samples treated and non-treated which is not a good indication for validity. And since it’s in both samples this suggests that human error was done in beta-actin preparation. Contrarily, better validity is seen in p21 readings in both samples, as they have lower CV values.
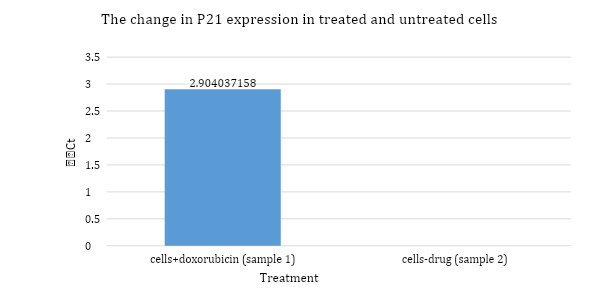
Figure 5: bar chart representing sample 1 treated, and sample 2 untreated samples and their respective ΔΔCt values calculated from the amplification of P21 and beta actin in qPCR.
The bar chart above shows that relative expression of p21 in treated cells has changed by a value of 2.9 compared to the untreated cells. Untreated cells result has a ΔΔCt value of zero as it represents the substitution of ΔCt from the same sample (untreated).
- Discussion:
RNA quality control (figure 2) revealed two bands corresponding to 18S RNA and 28S rRNA subunits. Having these distinct bands is an indication of good quality of RNA (Aranda, 2013). There is a third band labeled (A) in the gel, its consistency among the samples suggests that it’s not a random RNA contamination. It’s likely to be genomic DNA due to its large size ~10kbp. Genomic DNA contamination can be visualized in the top of the gel due to its large size that slows down its migration through the gel (Wieczorek et al., 2012). The results of gel electrophoresis indicate that RNA integrity is accepted to be used for qPCR.
Regarding the melt curve (figure 3 A), it is clearly shown that negative control is contaminated with DNA. The source of DNA contamination might be in the step of cDNA synthesis (figure 1 E) control was contaminated with reverse transcriptase enzyme, which resulted in generating cDNA in the control sample, and consequently p21 and beta-actin were amplified in qPCR.
Moving to the melt curve of the samples (figure 3 B). p21 and beta-actin have two clear, distinct, high intensity peaks. Which demonstrate the specificity of the amplification. However, there are to two other lower peaks. The peak at 75°C might be due to non-specific binding of the primers to a random non target region in the DNA templet (Anglès d’Auriac, 2016). It is less likely that this peak corresponds to a primer dimer since they usually have lower Tm values. The broad low peak at 68°C could be due to the formation of primer dimer, which can be explained by looking at table 1 where underlined bases of the primers’ sequences indicate complementarity that might lead to primer dimers. 68°C peak could also be a second amplicon. In a study by Ahberg and his team there has been shown a second amplicon which has a melting temperature of 68°C (Ahberg, et al., 2015) this depends on the sequence of the amplicon, particularly its GC content (Jiang et al., 2014). Nevertheless, the intensity of beta-actin and p21 peaks show that the main product of amplification was corresponding to our target genes.
Amplification plot of the control (figure 4A) confirms the presence of contamination with DNA, leading to the amplification of beta-actin and p21. Looking at the cycle threshold, exponential phase of amplification reached late at cycle 32 for p21 and cycle 26 for beta-actin which is indicative of minimal amount of contamination in the control.
Turning to the amplification plot of the treated and untreated samples (Figure 4 B, C) the two graphs show similar Ct value for beta-actin which is expected as reference genes must not be affected by the treatment nor any of the experiment conditions. (Kozera, and Rapacz 2013). While Ct value of p21 differs between the two samples, it is lower in treated cells. This result suggests that doxorubicin drug treatment influences the expression of p21 gene, which is confirmed by analyzing the data obtained from ΔCt value of the samples.
The difference between ΔCt from the treated and untreated samples (table 2) prove that the relative expression level has increased due to doxorubicin drug treatment. The value of ΔΔCt shows that fold change is 2.9 which demonstrates the effectiveness of this drug in upregulating p21 gene in MCF7 cancer cells.
In conclusion, this experiment confirms the hypothesis. As a DNA damaging agent, doxorubicin activates apoptotic pathway in MCF7 cancer cells, and consequently promotes the expression of p21 tumor repressor gene. This experiment requires further trials and optimization to avoid contamination that occurred in the control sample, and the low validity of beta-actin Ct results which was indicated by the coefficient of variance. Although these results are unreliable without further trials. However, the experiment has successfully proven a positive correlation between doxorubicin drug treatment and p21 expression, which could aid in future investigation of the role of doxorubicin in cancer treatment research.
- References:
Abbas, T., & Dutta, A. (2009). p21 in cancer: Intricate Networks and Multiple Activities. Nature Reviews Cancer, 9(6), 400–414. https://doi.org/10.1038/nrc2657
Ahberg, C. D., Manz, A., & Neuzil, P. (2015). Single Fluorescence Channel-based Multiplex Detection of Avian Influenza Virus by Quantitative PCR with Intercalating Dye. Scientific Reports, 5(1). https://doi.org/10.1038/srep11479
Anglès d’Auriac M. B. (2016). COMplementary Primer ASymmetric PCR (COMPAS-PCR) Applied to the Identification of Salmo salar, Salmo trutta and Their Hybrids. PloS one, 11(10), e0165468. https://doi.org/10.1371/journal.pone.0165468
Aranda, P. S., LaJoie, D. M., & Jorcyk, C. L. (2012). Bleach gel: a simple agarose gel for analyzing RNA quality. Electrophoresis, 33(2), 366–369. https://doi.org/10.1002/elps.201100335
Chen, J. (2016). The Cell-Cycle Arrest and Apoptotic Functions of p53 in Tumor Initiation and Progression. Cold Spring Harbor Perspectives in Medicine, 6(3), a026104. https://doi.org/10.1101/cshperspect.a026104
Jiang, C., Cao, L., Yuan, Y., Chen, M., Jin, Y., & Huang, L. (2014). Barcoding Melting Curve Analysis for Rapid, Sensitive, and Discriminating Authentication of Saffron (Crocus sativus L.) from Its Adulterants. BioMed Research International, 2014, e809037. https://doi.org/10.1155/2014/809037
Karimian, A., Ahmadi, Y., & Yousefi, B. (2016). Multiple functions of p21 in cell cycle, apoptosis and transcriptional regulation after DNA damage. DNA Repair, 42, 63–71. https://doi.org/10.1016/j.dnarep.2016.04.008
Kozera, B., & Rapacz, M. (2013). Reference genes in real-time PCR. Journal of Applied Genetics, 54(4), 391–406. https://doi.org/10.1007/s13353-013-0173-x
Thorn, C. F., Oshiro, C., Marsh, S., Hernandez-Boussard, T., McLeod, H., Klein, T. E., & Altman, R. B. (2011). Doxorubicin pathways. Pharmacogenetics and Genomics, 21(7), 440–446. https://doi.org/10.1097/fpc.0b013e32833ffb56
Verna, E. (2012). More attention should be paid on the interpretation of gene expression data. World Journal of Gastroenterology, 18(24), 3181. https://doi.org/10.3748/wjg.v18.i24.3181
Wang, X., Simpson, E. R., & Brown, K. A. (2015). p53: Protection against Tumor Growth beyond Effects on Cell Cycle and Apoptosis. Cancer Research, 75(23), 5001–5007. https://cancerres.aacrjournals.org/content/75/23/5001
Wieczorek, D., Delauriere, L., & Schagat, T. (2012). Methods of RNA Quality Assessment. Www.promega.com. https://www.promega.co.uk/resources/pubhub/methods-of-rna-quality-assessment/