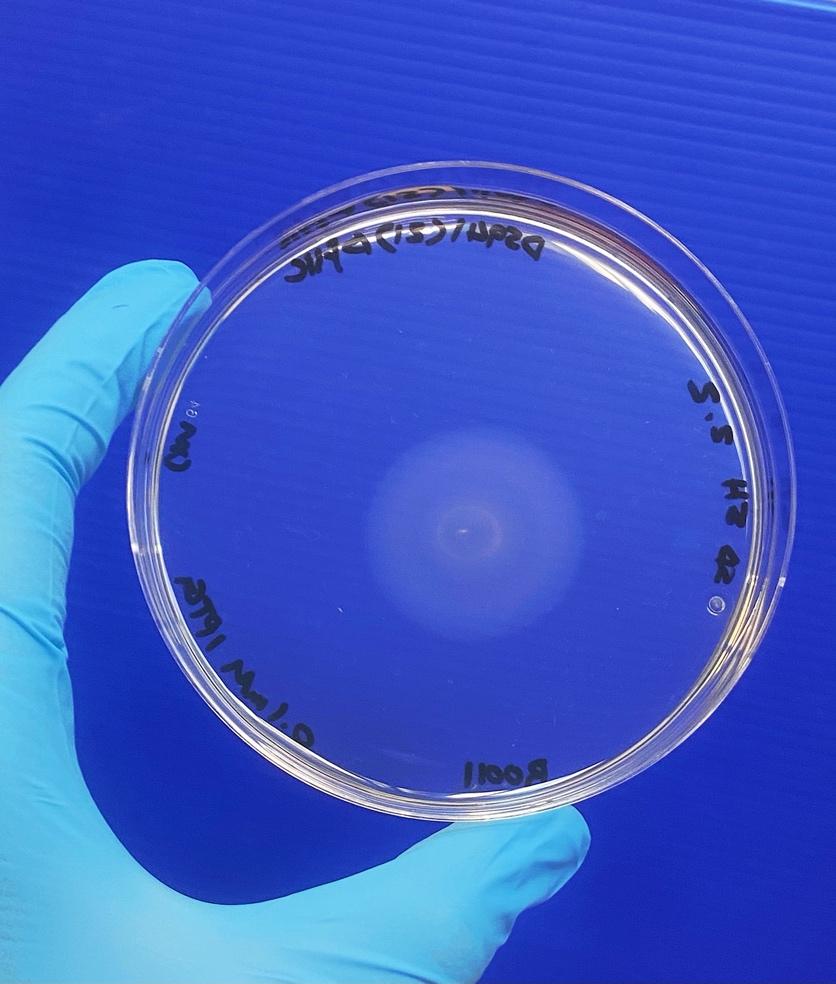
Fig. Motility test for fliC mutant strain transformed with fliC gene with IPTG regulated promoter
Abstract:
To investigate the strength of J23101, J23106 constitutive promoters and the IPTG-regulated R0011 promoter, DS941 Z1 ΔfliC mutated E. coli strain was transformed with plasmids encoding fliC gene regulated by the three promoters to determine their ability to restore its mobility. The results indicate that J23101 have the strongest activity as it restored 115% of motility followed by J23106 which restored 95% of motility. As for R0011 promoter, it is highly dependent on IPTG concentration. In absence of IPTG it restored 13% of motility, while motility increased to 53% with 0.1mM IPTG. Strains with no Z1 lac repressor showed significantly higher motility restorage in all IPTG concentrations. The results of GFP expression with the three promoters agree with those observed in fliC expression, as J23101 was stronger than J23106. And R0011 has lower activity at low IPTG concentrations around 0-0.01mM. However, its activity exceeded that of both constitutive promoters with 0.1-1mM IPTG. Results of this study suggest that optimum expression levels are achieved by R0011 promoter with 1mM of IPTG, and expression of the gene with R0011 could be downregulated by reducing IPTG concentration. As for the continues unregulated gene expression purposes, J23101 promoter could achieve higher gene expression compared to J23106.
Introduction:
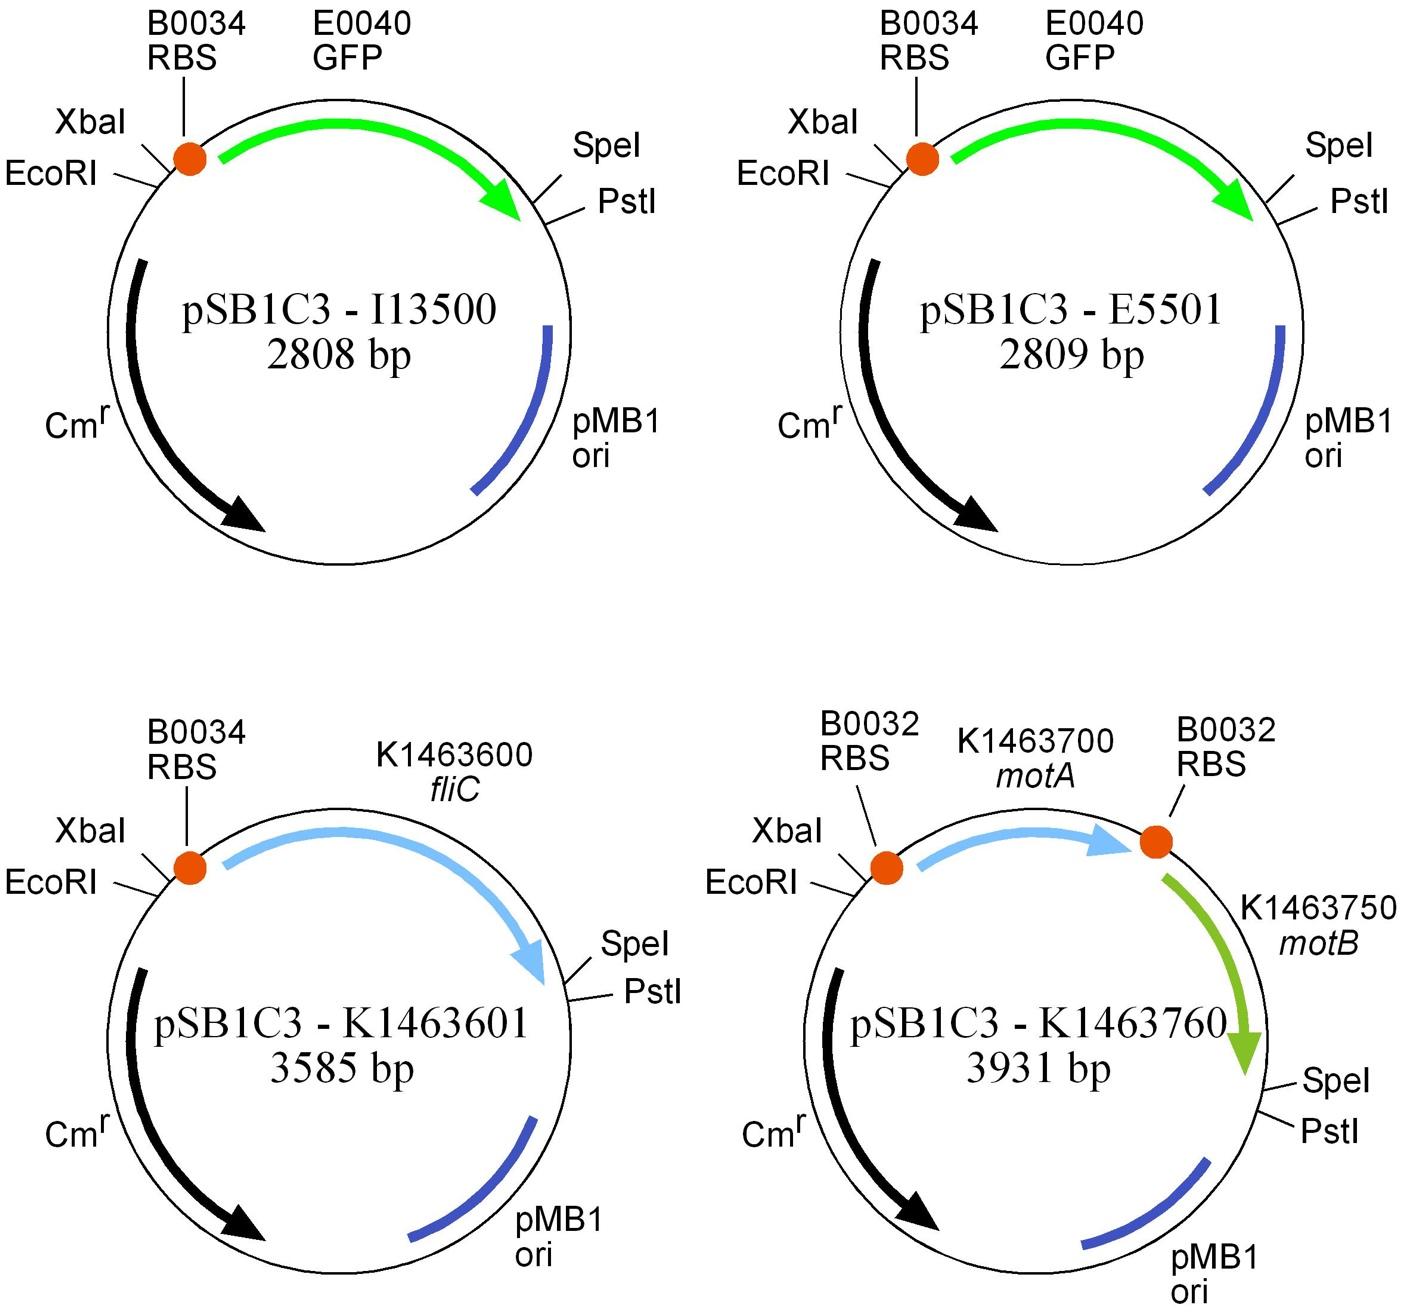
Synthetic biology is a new emerging approach to design and construct biological entities that serve certain functions, and produce useful products (Scott et al., 2015). To construct biologically functioning designs, it is very necessary to include efficient promoters in the design. Promoters are responsible of initiating gene expression by regulating RNA polymerase’ attachment to a given DNA sequence to transcribe it (Clancy, 2014). Constitutive promoters are unregulated promoters that can carry gene transcription in vivo and in vitro under all circumstances. (Qin et al., 2010). Studying the behavior and characteristics of promoters assesst in the choice of the right promoter for gene expression to design efficient biological systems. In this study, two constructive promoters BBa_J23101 and BBa_J23106 (Anderson, 2006) and compared to Isopropyl ß-D-1-thiogalactopyranoside (IPTG)-regulated promoter BBa_R0011 (Varshney et al., 2003). Promoters are examined by expressing two genes, first, the fliC gene, which is the gene encoding flagellin protein that when expressed polymerizes to form filaments to form flagella in Escherichia coli (E. coli). (Beutin et al., 2005) Here, fliC gene with upstream constructive promoter is introduced to a fliC mutant E. coli strain DS941 Z1 ΔfliC to test its ability to restore motility in the mutant bacteria. E. coli strain DS941 Z1 ΔfliC which have lost its ability to migrate through motility media. When transforming these cells with plasmid pSB1C3-K1463601 (Figure 1, A) that carries fliC gene with efficient promoter it is expected to restore their motility. Secondly, green fluorescent protein (GFP) gene is a protein displaying green emission when expressed (Remington, 2011) GFP emission can be measured to quantify protein level and determine the level of expression as an evaluation for promoters’ strength. when gfp gene with constructive promoters is inserted in plasmid PSB1C3-113500 (Figure 1, B) it can be used to test its expression in E. coli strain DS941 Z1. J23101 promoter is stronger than J23106 promoter (Anderson, 2006). Therefore, it is hypothesized that J23101 will restore higher motility level, and express higher GFP levels. DS941 Z1 E. coli strain used in this study have lac repressor Z1 (Lutz and Bujard, 1997) to determine its effect on R0011 promoter, in absence of IPTG DS941 Z1 will have the lac repressor inhibiting the expression, where in presence of IPTG inducer transcription is going to be initiated.
A B
Figure 1: Plasmids used to express gfp and fliC genes in DS941 E. coli strain
Methodology:
To express the genes of interest in E. coli strain DS941 Z1, plasmid PSB1C3-113500 was used to express gfp gene, and plasmid PSB1C3-K14d3601 was used to express fliC gene. The promoters’ oligonucleotides BBa_J23101, and BBa_J23106 were designed each with EcoR1 and Xbal sticky ends, in addition to a HindII site within the promoter for the selection. In addition, promoter BBa_R0011 promoter was used as an IPTG inducible promoter. The three promoters were inserted upstream of the fliC and gfp each in its respective plasmid between the EcoR1 and Xbal sites (Figure 1, A and B).
To investigate the optimum expression level DS941 Z1 ΔfliC was transformed with fliC gene and DS941 Z1 was transformed with gfp gene (Table 1). Motility test is performed for DS941 Z1 ΔfliC samples under different IPTG concentration, and GFP fluorescence reading is taken for the DS941 Z1 samples in addition to a time course IPTG induction for R0011 transformants. All techniques explained in synthetic biology course lab manual (Colloms, 2021)
Table 1: Transformants strain, gene, and promoters
| sample | E. coli strain | gene | Promoter |
| 1 | DS941 Z1 | gfp | None |
| 2 | R0011 | ||
| 3 | J23101 | ||
| 4 | J23106 | ||
| 5 | No DNA | ||
| 6 | DS941 Z1 ΔfliC | fliC | None |
| 7 | R0011 | ||
| 8 | J23101 | ||
| 9 | J23106 | ||
| 10 | No DNA |
Results:
Promoters design
To test the efficiency of constructive promoters J23101 and J23106 and compare them to IPTG regulated promoter R0011 they were constructed to have EcoRI and Xpal sticky ends to insert them in an appropriate plasmid to be expressed in DS941 Z1 E. coli strain, in addition to a HindIII site within the promoters sequence to indicate the presence of promoters in the plasmid. And to validate the presence of the appropriate promoters in the plasmids of gfp and fliC, restriction digest with HindIII + PstI was performed. In addition, digestion of the plasmids was done by EcoRI + PstI to validate the size of each plasmid when promoters are added, and for control, uncut plasmids, and plasmids without promoters cut with EcoRI where loaded in the gel.
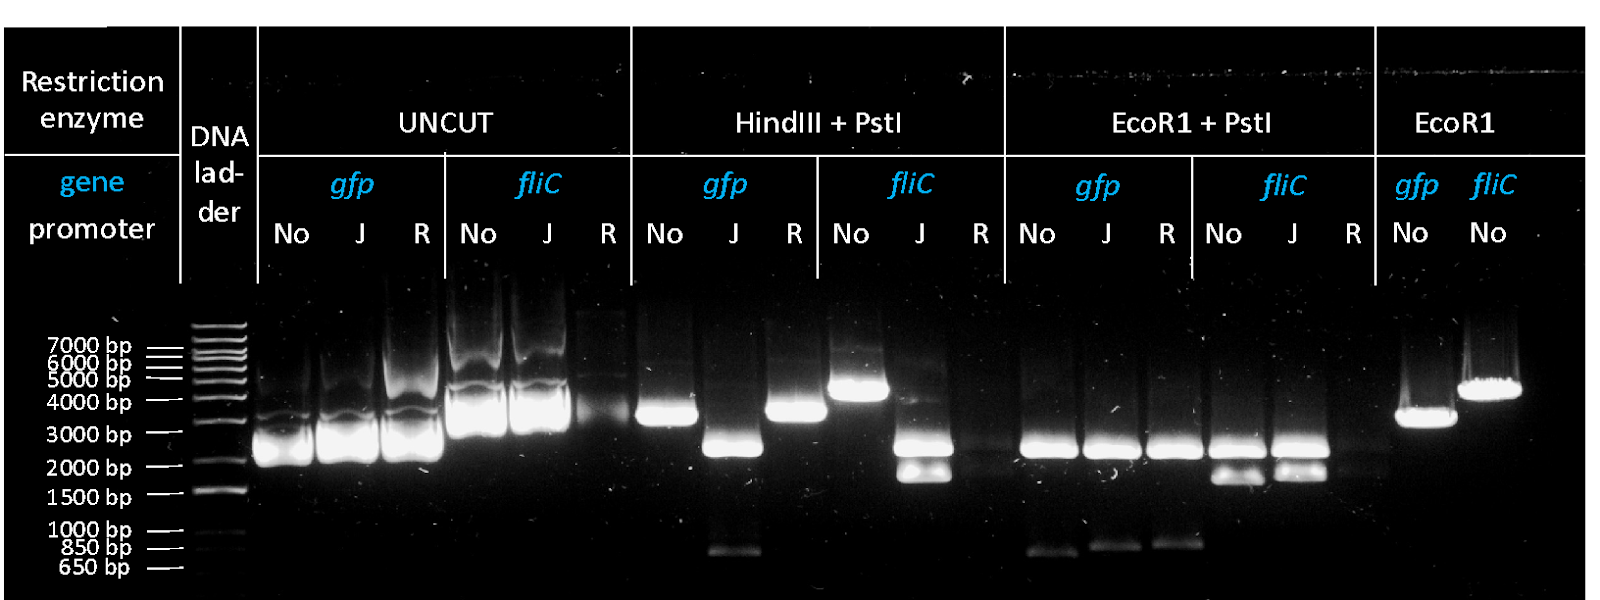
Figure 2: Image of gel electrophoresis for restriction digestion of plasmid DNA purified from DS941 Z1 cells transformants. Miniprep was performed for overnight cultures of all transformants to obtain plasmid DNA, and they were digested with HindIII+pstI, EcoRI+Pst and with EcoRI alone. (No: no promoter, J: J23106 promoter, R: R0011 promoter). Lane 1, 1kb DNA ladder. Lanes 2, 3, and 4, gfp uncut plasmids. Lanes 5,6, and 7, uncut fliC plasmids. Lane 8, 9, and 10 gfp plasmids cut with HindIII and PstI. Lanes 11, 12, and 13 fliC plasmids cut with HindIII and PstI. Lane 14, 15, and 16 gfp plasmids cut with EcoRI and PstI. Lanes 17, 18, and 19 fliC plasmids cut with EcoRI and PstI. Lanes 20, gfp plasmids with No promoter cut with EcoRI. Lane 21, fliC plasmid with No promoter cut with EcoRI.
Results (Figure 1) of restriction digestion show the original size of plasmid without promoter in lanes where no promoter was added that is ~3600 bp fliC plasmid, and ~2770 bp gfp plasmid. When promoters are added there is a slight change in band position that indicate presence of promoter in the plasmid. Looking at the uncut plasmids the bands look smeared due to using cyber safe in the experiment which makes these plasmids in a supercoiled form. In addition, a very fade band appears to indicate the presence of plasmid dimers that are double the size of the plasmids. fliC with R0011 have a very low concentration of DNA and this observation is consistent among all restriction digestion reaction, and that is due to error during miniprep DNA extraction, however since these results are qualitative the conclusions are drawn based on the presence of the band rather than their intensity. regarding HindIII+PstI reaction the results show a single band of ~2770bP in gfp plasmid and ~3600 in fliC plasmid indicating the absence of any promoter, however, when either J23106 or R0011 promoter is present, two bands are seen in the gel, because HindIII sequence was encoded in all promoters (as R0011 with RBS B0034 have HindIII site) used in this study. Then, When cutting the plasmids with EcoRI+PstI two bands are resulted in all samples, one is 2070 consistent band in all lanes that contains the plasmid alone, and the other band varies depending on the promoter in the sample, in absence of promoter it is ~700bp for gfp plasmid, and ~1500 for fliC plasmid, and when promoter is present the second band seems to be larger in size as it appears to be ~740 bp in gfp plasmid, and ~1540 for fliC plasmid. Finally, the plasmids where cut with EcoRI alone to see their original size in a linear form, and it shows that the size of gfp plasmid is 2770 bp, and size of fliC plasmid is 3600 bp.
Motility expression test
- Restoring motility by different promoters
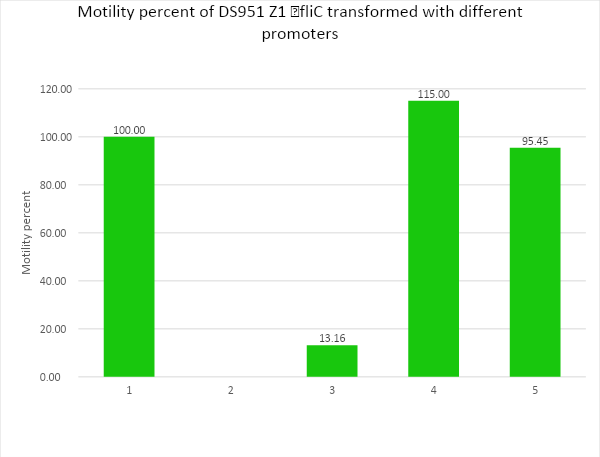
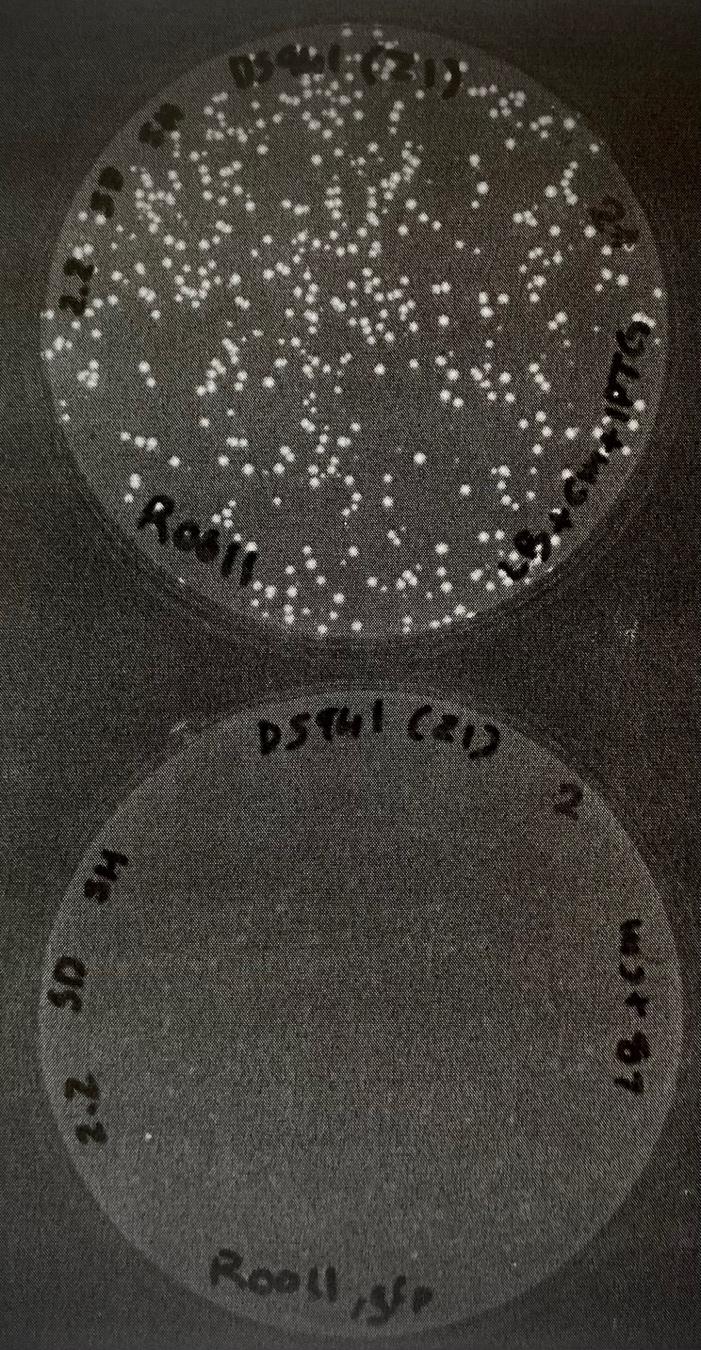
Figure 3: Motility percent in DS951 Z1 ΔfliC strain transformed by PSB1C3-K14d3601 plasmid with different promoters J23101, J23106 and R0011 compared to DS951 Z1 with the wildtype fliC gene. A spot from each sample was placed in the middle of a motility agar plate containing chloramphenicol (except for the negative control samples), and plates were incubated overnight at 25°C. the diameter travelled by bacteria in the media was measured and percent motility was found by following the formula: Motility percent= sample diameter of migration – diemeter of △fliC strain / dimeter of WT strain – diemeter of △fliC strain x 100%
Firstly, DS951 Z1 strain with the wild-type fliC gene represents positive control with 100% motility, and the mutant DS951 Z1 ΔfliC strain represents negative control with 0% motility. (Figure 3) All promoters have restored motility with different levels, transformants with J23101 and J23106 promoters show high motility percentage of 115% and 95.45% respectively. However, transformants with R0011 promoters have restored motility by only low level of 13.16%, As R0011 is an IPTG-regulated promoter, it was further tested with adding IPTG to the motility test and compared to DS951 ΔfliC strain in presence and in absence if IPTG inducer.
- Restoring motility by IPTG-regulated R0011 promoter
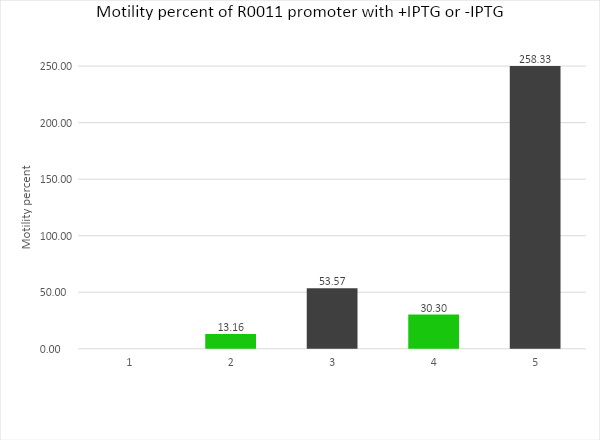
Figure 4: Motility percent in DS941 Z1 ΔfliC transformed with R0011 promoter in absence of IPTG and in presence of 0.1mM of IPTG inducer. Results presented compared with DS941 ΔfliC strain results obtained from another group (JC and EX, group 8.1 week 2) which have examined DS941 ΔfliC strain lacking lac repressor, under similar experimental conditions including promoter choice R0011, temperature 25°C and IPTG concentration 0mM and 0.1mM.
Motility test for the R0011 promoter transformants (Figure 4) show that in absence of IPTG, motility was not completely absent as the negative control, suggesting that fliC gene was not completely silenced, it was expressed in a low level 13.16%. and when IPTG is added the motility percentage increased to 53.57% which is more than four folds increase. These results were compared to the results obtained from another group that have worked with DS941 ΔfliC strain lacking the lac repressor, to investigate the effect of lac repressor on the regulation of gene expression. The comparison revealed that the change in motility percentage in _IPTG and -IPTG in the DS941 ΔfliC strain is almost the double as that observed in the DS941 Z1 ΔfliC stain, as in strain lacing lab repressor, motility percentage of fliC have increased from 30.30% to 258.33% which is more than eight-fold increase. The results indicate that transformants with R0011 have restored motility, however in a low level in absence of IPTG inducer.
GFP expression test
- Expressing GFP by different promoters with IPTG
The efficiency of the constitutive promoters to express GFP was tested at different IPTG concentrations and fluorescent was measured.
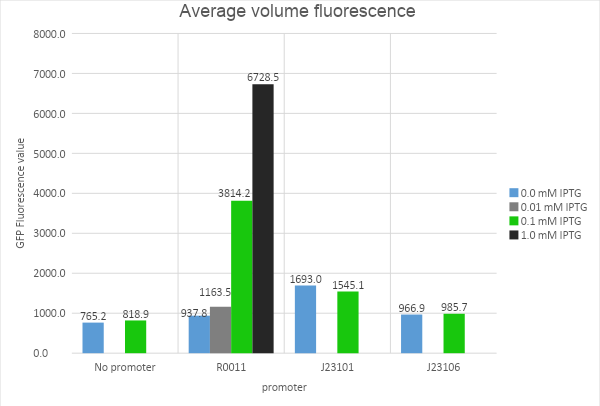
Figure 5: Fluorescence measurement from GFP expressed in DS941 Z1 strain transformed by PSB1C3-113500 with different promoters at different concentrations of IPTG. DS941 Z1 transformants cultured in L-broth were incubated overnight at 37°C with and then plated in a 96-well plate to measure fluorescence. The no promoter, J23101 and J23106 are negative control for the effect of IPTG concentration on GFP expression
Results of Fluorescence measurement (Figure 5) indicate that all the promoters have successfully expressed GFP protein in the DS941 Z1 strain, with highest expression level observed in R0011 promoter transformants with >0.1mM IPTG. When comparing the expression level of GFP with each promoter against the IPTG concentration, the results show that IPTG have an effect only on R0011 promoter, increasing the expression from less than 1000 in absence of IPTG up to more than 3814 in 0.1 mM of IPTG. Where no significant change is observed in the expression of GFP by J23101 and J23106 promoters when IPTG is added. However, J23101 and J23106 promoters show higher GFP expression compared to R0011 promoter when low IPTG concentration is used. (image in figure 8 supplementary information)
- IPTG induction time course
Time course investigation for GFP expression in DS941 Z1 cells transformed with plasmid PSB1C3-113500 carrying gfp gene with R0011 promoter as response to IPTG induction was measured and recorded every 30 min. 0.1mM of IPTG inducer added when cells are growing exponentially, and the expression of GFP compared to a similar strain where IPTG was not added
A B
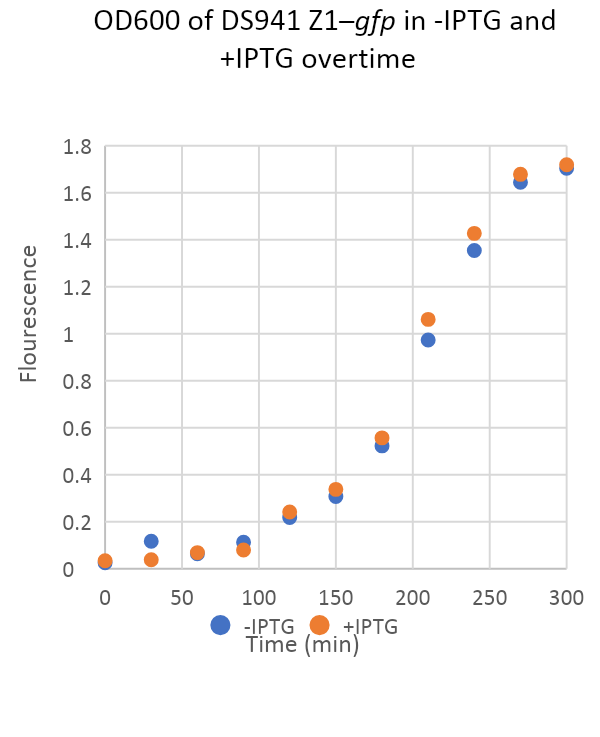
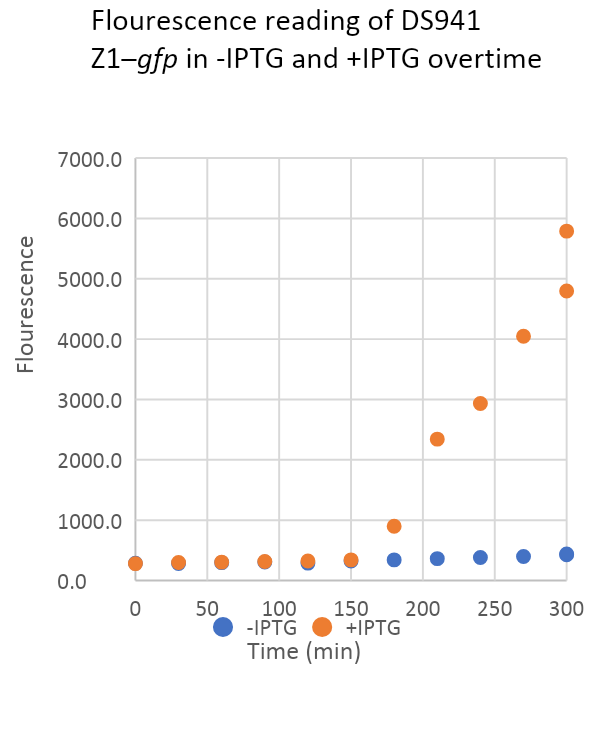
Figure 6: IPTG induction time course (A) OD600 measurment by spectrophotometer every 30 min from time course -IPTG and +IPTG of DS941 Z1–gfp with R0011 promoter, (B) The average flourescence reading from time course -IPTG and +IPTG from DS941 Z1–gfp with R0011 promoter for samples collected every 30 min.
To investigate the effect of IPTG on cells growth and gene expression, OD600 and fluorescence were recorded every 30 minutes. From (figure 6, A) the growth of both DS941 Z1–gfp strains measured as optical density OD600 was similar in presence and in absence of IPTG, which indicates that IPTG didn’t have any effect on the growth and development of the cells. However, looking at (figure 6, B) GFP expression, there is a significant increase in GFP expression in the +IPTG sample right after IPTG is added (image in figure 9, supplementary information). The results indicate that IPTG have upregulated the expression of gfp gene with R0011 promoter when IPTG was added in 150 min.
Discussion:
In restriction digest results (Figure 2) the uncut samples show two bands of intensity ratio of 19:1, where the largest fragment size represents plasmid dimer of two plasmids combined, and the main band with higher intensity and smaller size shows the regualr plasmid size of 2808bp for the gfp and 3585bp for fliC. The samples cut with HindIII+PstI show the have cut the plasmids only where the promoters are present. Both gfp and fliC plasmids with no promoter generated single linear fragment of the original plasmid size, However they have generated two bands when they have J23106 and R0011 promoters inserted, indicating the presence of the promoter sequence which contains HindIII site. As for the samples cut with EcoRI and PstI they have all generated two bands, a band of size 2070bp that contains the plasmid, and the second fragment is smaller in size for the samples where no promoter was inserted. As for the samples which contained promoters they show a band of size 1540bp -1530bp for the fliC and 740bp for the gfp. Finally for the samples cut with only EcoRI they show single linear band of the original plasmid size for both gfp and fliC plasmids. The results obtained from restriction digestion indicate that the ligation of promoters in the appropreate plasmids was seccessful in all samples, the sizes of plasmids with and without promoters inserted were as expected according to the plasmids map (Figure 1).
As for the motility test (Figure 3) positive control DS941 Z1 have 100% motility. While the mutant DS941 Z1 ΔfliC with no promoter shows no motility. Results indicate that J23101 have the highest expression activation as it restored 115% of motility, followed by J23106 that restored almost 95% of motility. And R0011 have low expression at low IPTG concentration as 0.01-0.1mM it restored only 13% of motility without IPTG and more than 50% of motility at 0.1%. In comparison of results from group who have transformed DS941 ΔfliC strain lacking lac repressor, expression with R0011 was significantly higher as it restored 30% of motility without IPTG and it restored 258% of motility with only 0.1 mM IPTG (Figure 4). Motility restored by IPTG-regulated R0011 promoter suggest that there is an expression leakage when using R0011, as in absence of IPTG there was low motility level. Adding IPTG have increased the motility in both DS941 and DS941 Z1 strains, which means that IPTG could induce the expression in presence and absence of lac repressor. This observation was consistent when comparing the results of different groups in the lab. And it suggests that lac repressor have decreased the expression in all samples but it didn’t completely inhibited the transcription in -IPTG and +IPTG and not selectively inhibited the -IPTG samples. When adding IPTG expression is increased in all samples. Therefore, for the sample that doesn’t have lac repressor, when IPTG was added, the expression was the highest. And the lowest expression observed was in the strain with lac repressor in absence of IPTG. This is explained as lac repressor binds to gene operator preventing transcription, however, sometimes not enough lac repressor is present, and transcription is initiated even in absence of IPTG, when IPTG is present it inhibits lac repressor allowing higher expression of the gene (However, 2001). According to the results above the regulation of R0011 is not very selective to stop gene expression in absence of inducer, However, it could be useful to regulate gene expression to some extent as gene expression leakage was not very high in low gene expression level.
The results obtained from GFP expression test agree with those observed in motility test in terms of which promoter was stronger. J23101 promoter have higher expression level than J23106, and both are not significantly affected by IPTG inducer. while R0011 show a low expression at low concentrations of IPTG, however, expression by R0011 is increased when higher concentration of IPTG is used (Figure 5) As for the GFP induction in IPTG induction time course, both DS941 Z1-gfp strain show identical growth level recorded as OD600 indicating the IPTG didn’t interfere with their growth (figure 6). However, GFP expression have increased significantly as 0.1mM IPTG was added to the +IPTG sample. This experiment agrees with the previously discuses results that R0011 is upregulated by IPTG.
In conclusion, this study show that constructive promoters have successfully restored motility of fliC mutant DS941 Z1 E. coli strain and have successfully expressed gfp in DS941 Z1 E. coli strain. It is proven that the hypothesis drawn is correct, as the J23101 promoter is a stronger than J23106, and both are unregulated constructive promoters that continuously express the gene of interest without any inducer. R0011 promoter was weaker than both J23101 and J23106 promoters in expressing fliC and GFP at low concentrations of IPTG, while at high concentrations of IPTG >0.1mM expression increases to exceed the expression level by J23101 and J23106 promoters. R0011 promoter have the advantage of regulating expression by IPTG inducer, therefore it could be used at specific conditions instead of carrying continuous expression depending on the purpose of expression. However, expression leakage in R0011 promoter makes it less efficient to selectively express a gene at certain condition. Further experimental trials are required to test the expression at higher concentrations of IPTG to investigate the optimum gene expression using R0011 promoter.
References:
Anderson, J. (2006). Part:BBa J23101 – parts.igem.org. Parts.igem.org. https://parts.igem.org/Part:BBa_J23101
Anderson, J. (2006). Part:BBa J23106 – parts.igem.org. Parts.igem.org. http://parts.igem.org/Part:BBa_J23106
Beutin, L., Strauch, E., Zimmermann, S., Kaulfuss, S., Schaudinn, C., Männel, A., & Gelderblom, H. R. (2005). BMC Microbiology, 5(1), 4. https://doi.org/10.1186/1471-2180-5-4
Clancy. (2014). DNA Transcription | Learn Science at Scitable. Nature.com. https://www.nature.com/scitable/topicpage/dna-transcription-426/
Colloms, S. (2020). Synthetic biology lab, Mini iGEM project, EXPERIMENTAL PROGRAMME FOR 4-DAY LAB. UofG MSc biotechnology 2021/22
Hoover, T. R. (2001). Encyclopedia of Genetics (S. Brenner & J. H. Miller, Eds.) [Review of Encyclopedia of Genetics]. https://doi.org/10.1006/rwgn.2001.0544.
Lutz R, Bujard H. Nucleic Acids Res. 1997 Mar 15;25(6):1203-10. doi: 10.1093/nar/25.6.1203. PMID: 9092630
Qin, J. Y., Zhang, L., Clift, K. L., Hulur, I., Xiang, A. P., Ren, B.-Z., & Lahn, B. T. (2010). Systematic Comparison of Constitutive Promoters and the Doxycycline-Inducible Promoter. PLoS ONE, 5(5), e10611. https://doi.org/10.1371/journal.pone.0010611
Remington, S. J. (2011). Green fluorescent protein: A perspective. Protein Science, 20(9), 1509–1519. https://doi.org/10.1002/pro.684
Scott, D., Abdelhakim, D., Miranda, M., Höft, R. and Cooper, H.D. (2015). Potential positive and negative impacts of components, organisms and products resulting from synthetic biology techniques on the conservation and sustainable use of biodiversity, and associated social, economic and cultural considerations. Part I of: Synthetic biology. Secretariat of the Convention on Biological Diversity. Montreal, Technical Series No. 82, 60 pages.
Varshney, N., Kenney, G., Shen, D., & Sutton, S. (2003). Part:BBa R0011 – parts.igem.org. Parts.igem.org. https://parts.igem.org/Part:BBa_R0011
Supplementary information
GFP expression by R0011 promoters in +IPTG and -IPTG
-IPTG +IPTG
Figure 7: comparison between GFP expression level in DS941 Z1 transformed with R0011 promoter in -IPTG and +IPTG media.
GFP expression by different promoters

Figure 8: Image of level of gfp expression from DS941 Z1 strain with different promoters at under different concentrations of IPTG
GFP expression in IPTG induction time course
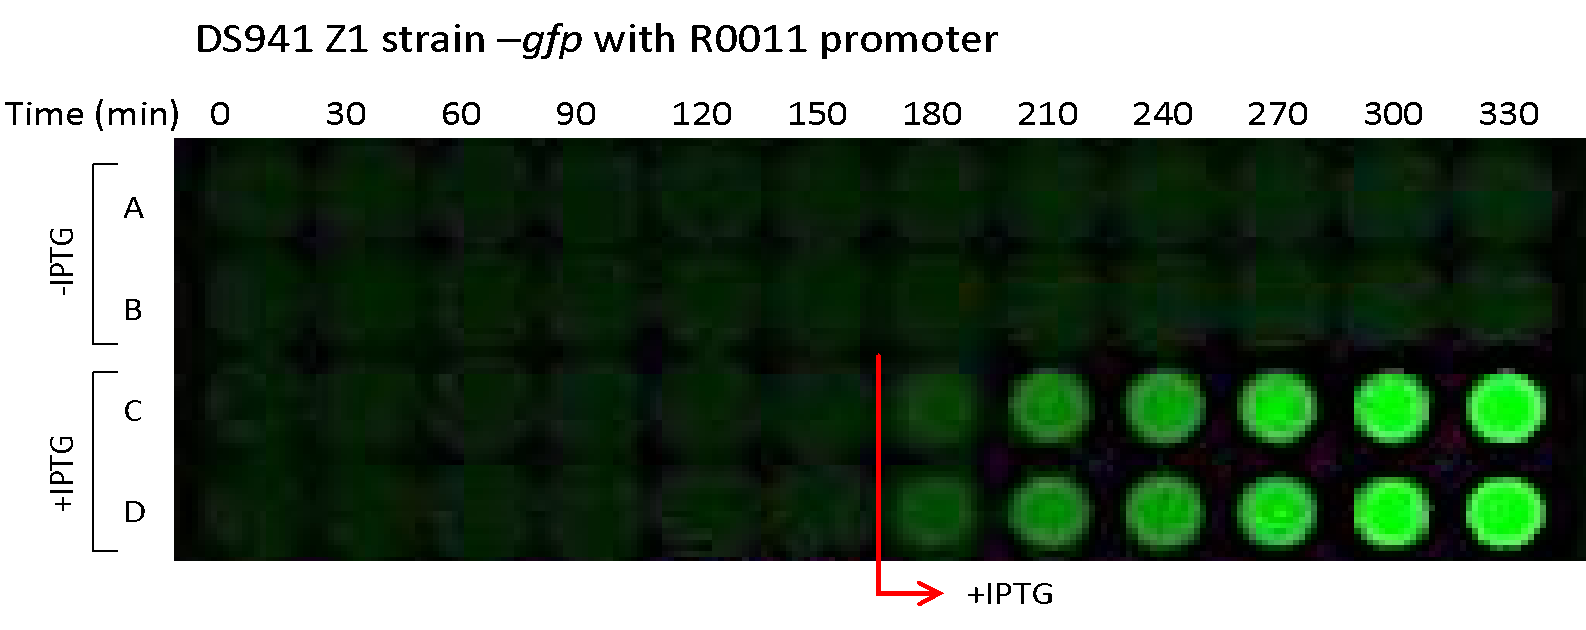
Figure 9: Image of 96-well plate time course measurements to evaluate GFP expression levels emitted from DS941 Z1 strain –gfp with R0011 promoter with and without IPTG
Relative concentration of expression
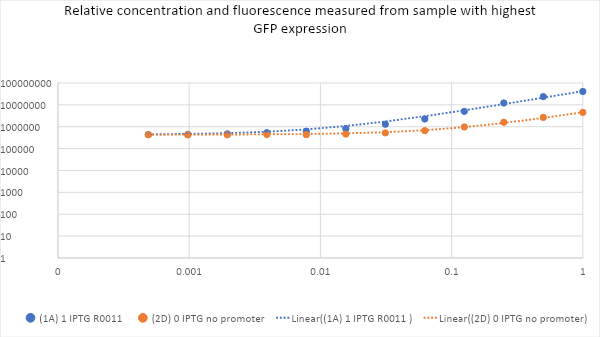
Figure 10: Flourescence measured from the dilution of the highest concentration of GFP sample R0011 with 1mM IPTG, and the lowest expression from the negative control sample with 0mM IPTG and no promoter. The sample with the highest GFP expression, DS941 Z1 R0011 in 1mM of IPTG, was compared to the least expressed control sample DS941 Z1 with no promoter in 0mM of IPTG. The two samples were diluted to indicate how linear the fluorescence reader is with cell concentration that is supposed to be proportional to gfp concentration.